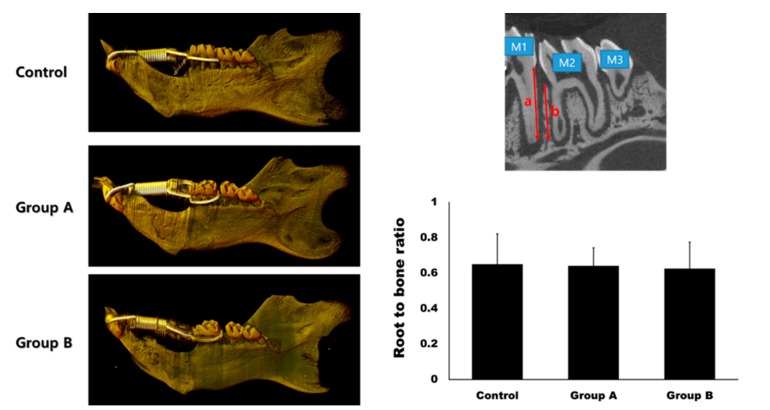
Figure 5.
Micro-computerized tomogram. The gap between the first molar (M1) and the second molar (M2) was much wider in Group A and B compared to the control group at day 14. The root-to-bone ratio was measured at the distal surface of the distal root of M1. It was calculated as the ratio between the root length (a) and bone height (b). There was no significant difference in the root-to-bone ratio among the groups (p > 0.05).

