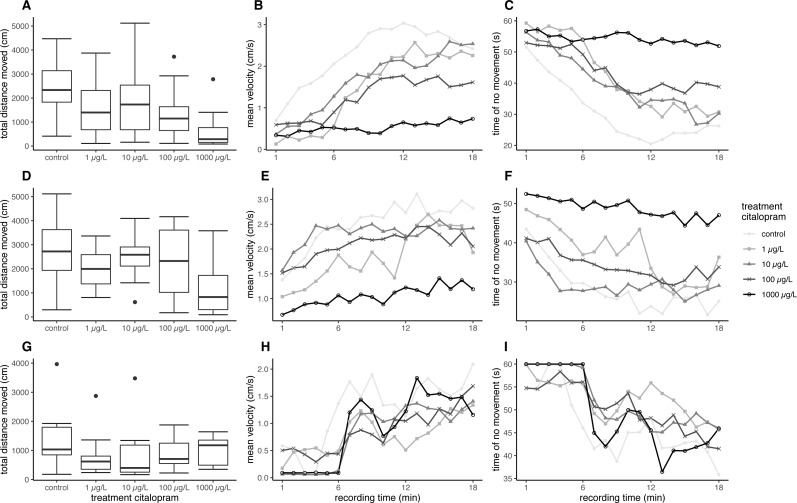
Figure 1. Results for brown trout in the ASMD.
Results of total distance moved are shown as boxplot (A, D, G), Results of mean velocity (B, E, H) and time of no movement (C, F, I) are represented as dots, with depicted mean values over time. (A–C) Results for brown trout larvae exposed at 7 °C, (D–F) Results for brown trout larvae exposed at 11 °C, (G–H) Results for juvenile brown trout.

