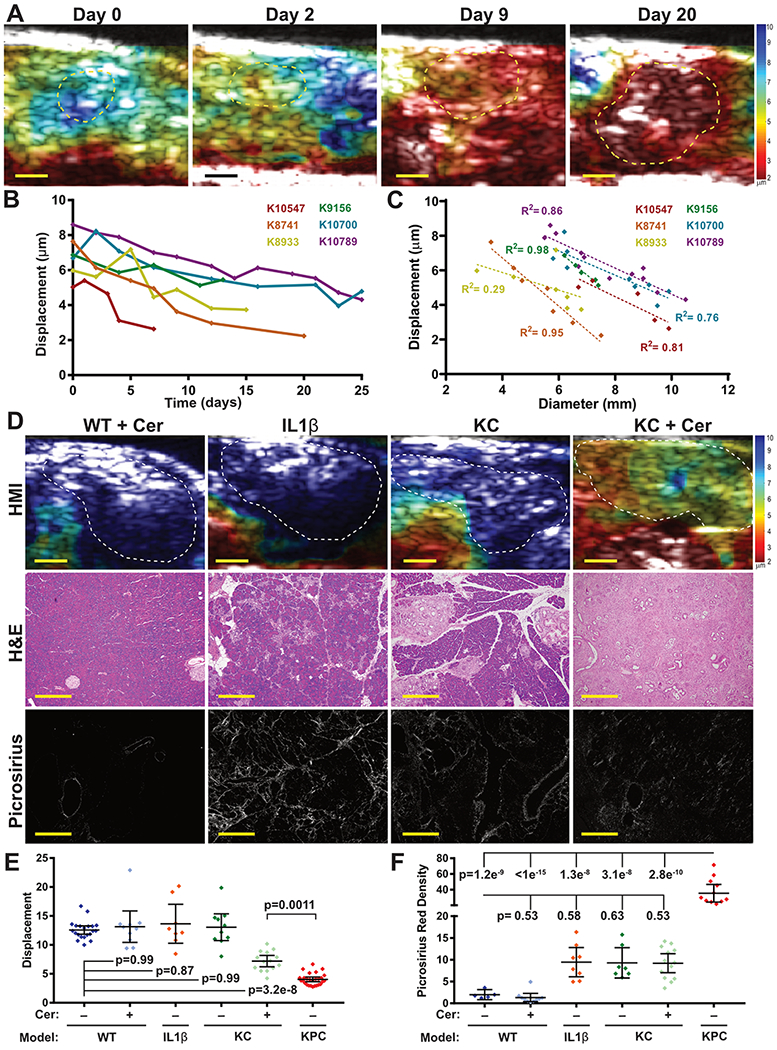
Figure 2. Pancreatic stiffness increases with disease progression.

(A) Longitudinal HMI displacement maps of a KPC mouse (K8741) showing increased stiffness over the course of 20 days of tumor growth. Bars = 2mm. (B) Quantification of tissue stiffness from six KPC mice demonstrates a consistent decrease in stiffness over time following tumor initiation. (C) The stiffness of each tumor from (B) is strongly inversely correlated with tumor size (mean R2= 0.78). (D) Representative HMI displacement maps, H&E and picrosirius images of pancreatic tissues from four models of pancreatitis: wild-type mice treated with cerulein (WT+cer), Elastase-interlukin 1β transgenic mice (IL1β), KrasLSL.G12D/+; Pdx1-Cretg/+ (KC) mice, and KC mice treated with cerulein (KC+Cer). Bars = 2mm for HMI maps, 200μm for H&E, and 40μm for picrosirius images. (E) Stiffness was significantly increased in the pancreata of KC mice treated with cerulean, but all pancreatitis models were significantly less stiff than KPC pancreatic tumors. Selected statistical comparisons shown using a 1-way ANOVA and Tukey’s multiple comparisons test between all groups. (F) Quantification of picrosirius red staining found increased collagen deposition in KPC tumors versus all other groups (1-way ANOVA + Tukey’s between all groups). IL1β, KC, and KC+cer mice had modestly elevated collagen deposition, but this was not statistically significant after multiple hypothesis correction.
