
Figure 3. Pancreatic tumor stiffness is altered by therapeutic intervention.
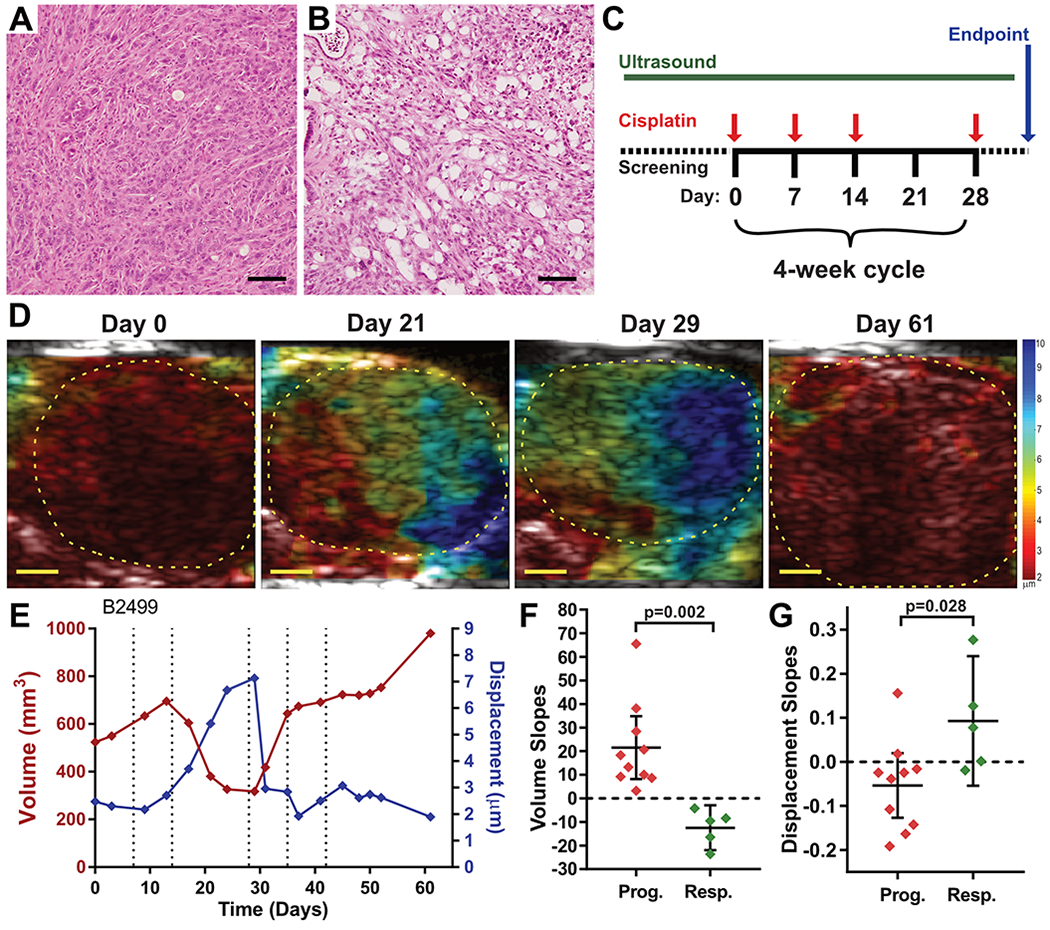
(A,B) H&E histopathology images from two KPCB2F/F pancreatic tumors treated either with saline (A) or with cisplatin. Bars = 200μm. (C) Experimental design for therapeutic study of KPCB2F/F mice. Tumor bearing mice were identified by high resolution ultrasound and then treated with 3mg/kg cisplatin, i.v., once weekly for three weeks, followed by a one-week rest cycle. This four-week cycle was repeated with longitudinal HMI until mice met endpoint criteria. (D) HMI displacement maps for a KPCB2F/F mouse treated with cisplatin (B2499) over time. Bars = 2mm. (E) Longitudinal tumor volume and HMI displacement measurements of Mouse B2499. Red curve indicates tumor volume, blue curve indicates tumor HMI displacement. Dotted lines indicate dates of cisplatin treatment. (F,G) Quantification of tumor growth slopes and displacement slopes, respectively, for progressing and responding curve segments as delineated in fig. S3, compared using Student’s T-test.