
Figure 4. Elevated tissue stiffness in human PDA.
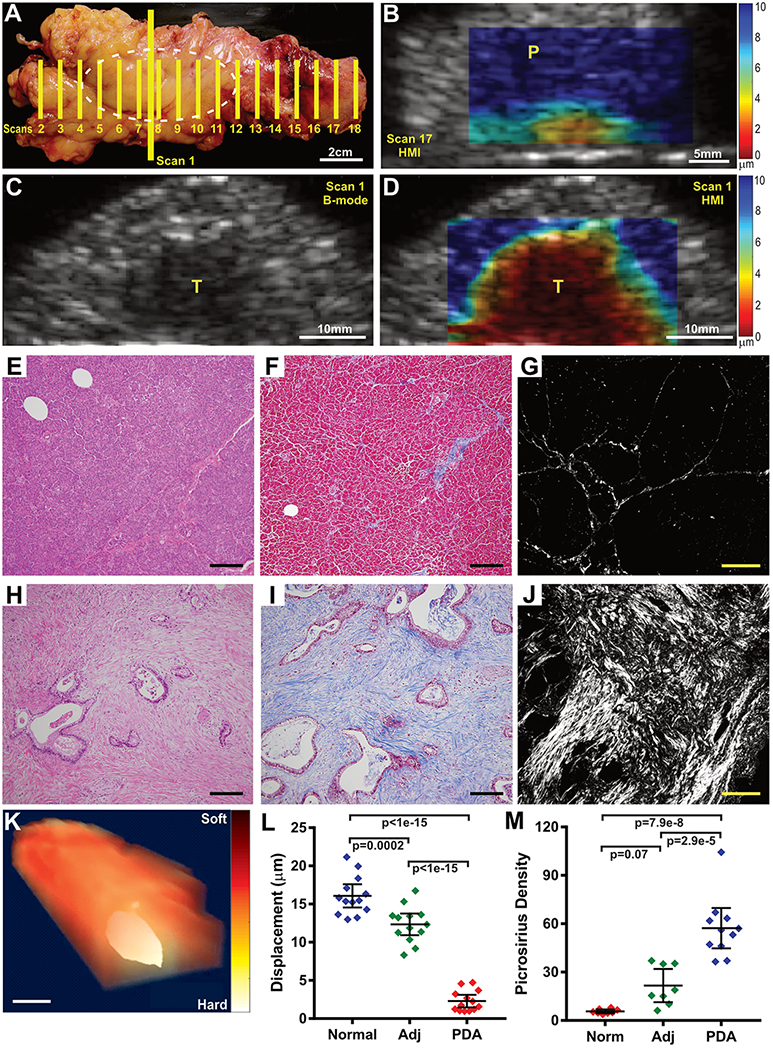
(A) Photograph of a distal pancreatectomy specimen. Hashed white oval indicates position of a pancreatic ductal adenocarcinoma. Yellow lines indicate imaging planes. (B) HMI displacement map from Scan 17 in (A) showing that the mostly normal pancreas tissue (labelled P) distal to the tumor is soft (blue color). (C,D) B-mode (C) and HMI displacement images (D) from Scan 1 in (A), depicting the main mass of the pancreatic tumor (labelled T). Notably, the borders of the tumor in the B-mode image are indistinct. By comparison, the HMI maps clearly distinguishes the extent of disease. (E-J) Microscopic images of the sample from (A) showing normal pancreas uninvolved with tumor (E-G) compared to the center of the adenocarcinoma mass (H-J). Tissue sections are stained with H&E (E,H, bars = 200μm), Mason’s Trichrome (F,I, bars = 200μm), or picrosirius red (G,J, bars = 40μm). PDA images show evidence of the extensive extracellular matrix deposition that is characteristic of pathology of pancreatic cancer and contribute to increased stiffness. (K) A 3D rendering of the resection specimen from (A) using HMI results from Scans 2-17, clearly indicates the location of the tumor. Bar = 25mm (L) Quantification of tissue displacement for 13 human PDA specimens (PDA) compared to adjacent inflamed pancreas (Adj) or largely normal pancreas tissue (Norm), when present. Pancreatic tumor tissue was significantly more stiff than inflamed or normal pancreatic tissue (1-way ANOVA + Tukey’s). (M) Quantification of picrosirius red staining on samples from 12 PDA specimens showing increased collagen deposition in PDA versus adjacent inflamed or normal pancreatic tissue (1-way ANOVA + Tukey’s).