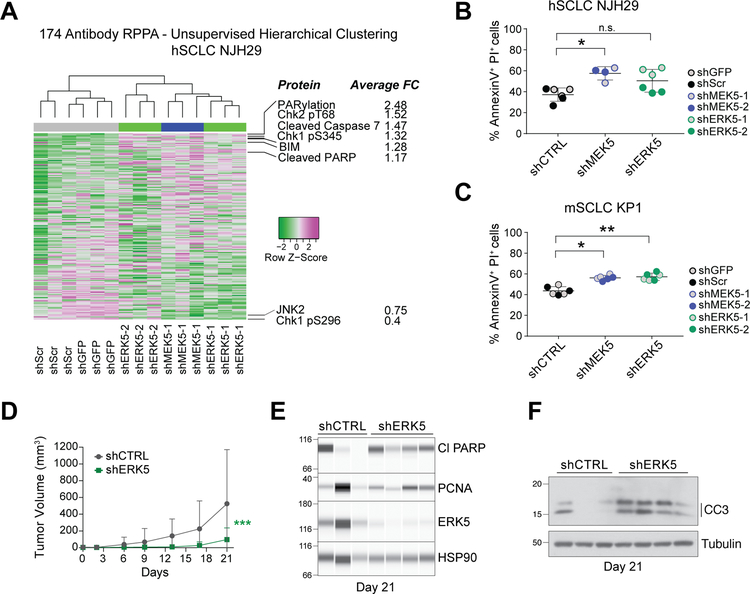
Figure 2: MEK5 and ERK5 knock-down induces cell death in SCLC cell populations.
(A) Unsupervised hierarchical clustering of all protein quantities measured by Reverse Phase Protein Array (RPPA) separates hSCLC NJH29 cells with MEK5 and ERK5 knockdown, from those with shCTRL knockdowns (shGFP and shSCR) (top); for proteins with average fold change (FC) across all ERK5 and MEK5 hairpins larger than 1.15 or smaller than 0.75, protein names and average FCs are noted.
(B-C) Knockdown of MEK5 and ERK5 in hSCLC NJH29 (B) and mSCLC KP1 (C) SCLC cells results in a higher rate of cell death by apoptosis as measured by AnnexinV/PI staining and flow cytometry after 2 days of growth in 2% serum conditions; n.s., p>0.05, *, p<0.05, **, p<0.01 by t-test following one-way ANOVA (p=0.0115 for (B) and p=0.004 for (D)); grey and colored dots represent 2 different shRNAs per group, and n=2–3 independent experiments per individual hairpin.
(D) Volume of tumors resulting from subcutaneous injections of hSCLC NJH29 cells expressing shERK5 (one shRNA) or shCTRL (shGFP) during 3 weeks of growth in the flanks of NSG recipient mice (n=12 tumors per group, error bars represent S.E.M.). 2-way ANOVA interaction p=0.0002, *** shown in graph.
(E) Immunoassays for ERK5, the cell death marker cleaved PARP (Cl PARP), and the cell cycle marker PCNA on extracts from NJH29 tumors in (D) at day 21 of growth. Tumors were selected to minimize differences due to tumor size (n=3 shCTRL and n=4 shERK5). Protein levels are relative to the loading control HSP90.
(F) Immunoblot as in (E) for the cell death marker cleaved caspase 3 (CC3). Tubulin is a loading control.

