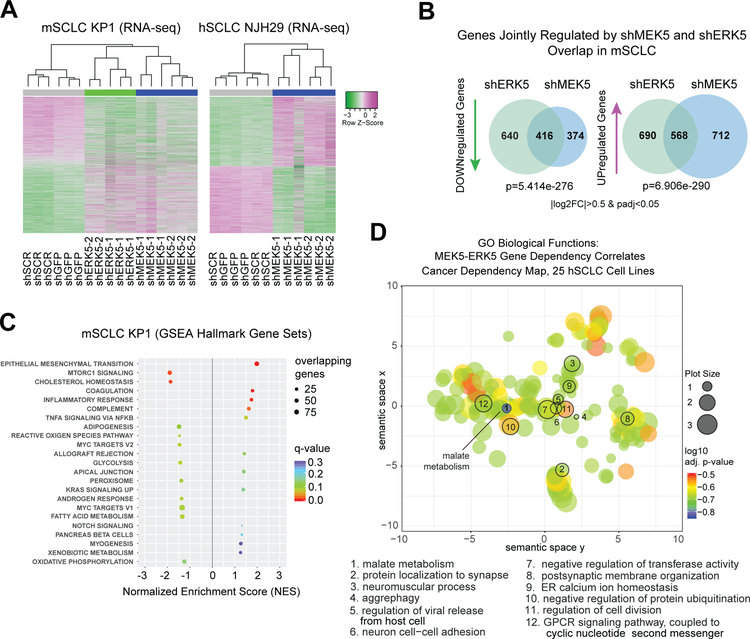
Figure 3: MEK5 and ERK5 knock-down perturbs metabolic pathways in SCLC cells.
(A) Unsupervised clustering from RNA-seq data upon MEK5-ERK5 knockdown in mSCLC KP1 cells, and MEK5 knockdown in hSCLC NJH29 cells; allgenes with |log2FoldChange|>0.5 and adjusted p-values <0.05 were included in the analysis from any comparison); n=2–3 independent replicates per hairpin.
(B) MEK5 and ERK5 knockdown in mSCLC KP1 cells change the transcriptome in similar ways, with significantly overlapping gene sets being downregulated and upregulated; hypergeometric test used to obtain p-value of overlap; only genes changing by a |log2 fold change|>0.5 and an adjusted p-value<0.05 were considered.
(C) Hallmarks Gene Set Enrichment Analysis (GSEA) gene sets significantly enriched or disenriched when the MEK5-ERK5 axis is downregulated in mSCLC KP1 cells compared to controls; log2 fold change values averaged for shMEK5 and shERK5, respectively, each compared to shCTRLs (shGFP and shSCR), to focus analysis on genes controlled by both kinases; only enriched sets with q-values <0.3 are shown.
(D) Gene Ontology Biological Function term results from Enrichr, for the set of 63 genes with a Pearson correlation coefficient of over 0.5 between their dependency scores and those of both MEK5 and ERK5 in 25 hSCLC cell lines from the Cancer Dependency Map project, analyzed by ReviGO, and mapped based on their semantic similarity; GO IDs with a dispensability score <0.15 are numbered and stated in the legend below; bubble or plot size is proportional to frequency of Homo sapiens UniProt entries associated with that GO ID, color specifies log10 adjusted p-value for that GO ID from Enrichr.

