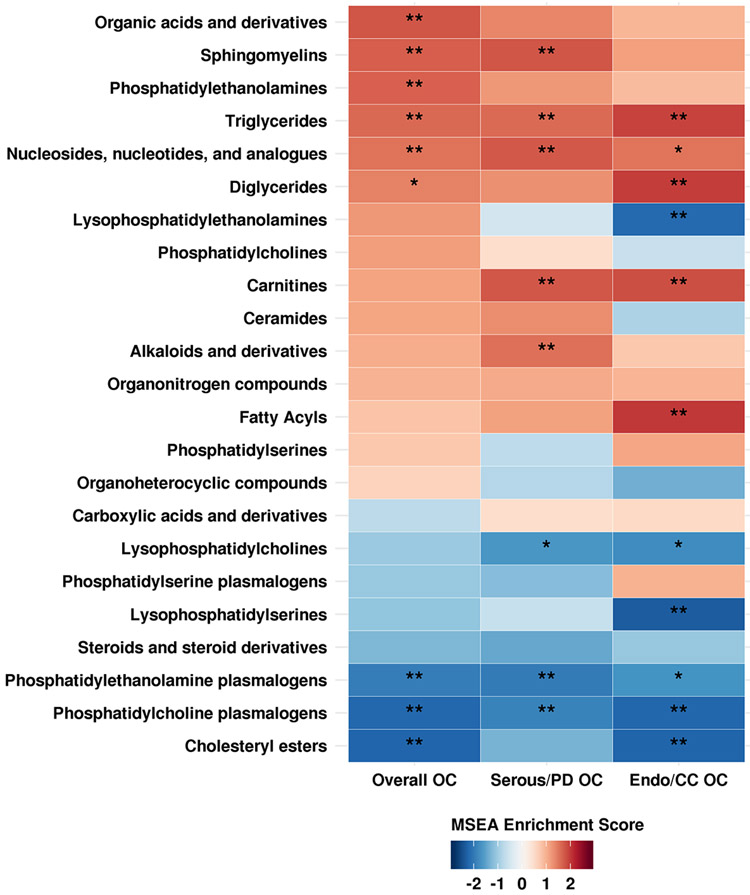
Figure 2: MSEA results. Enriched metabolite groups associated with risk of overall OC, serous/poorly differentiated OC (Serous/PD OC) and endometrioid/clear cell OC (Endo/CC OC).
Significance of the association is overlaid on the heat map and marked as follows: * FDR ≤0.2, ** FDR ≤0.05; all other FDR >0.2.

