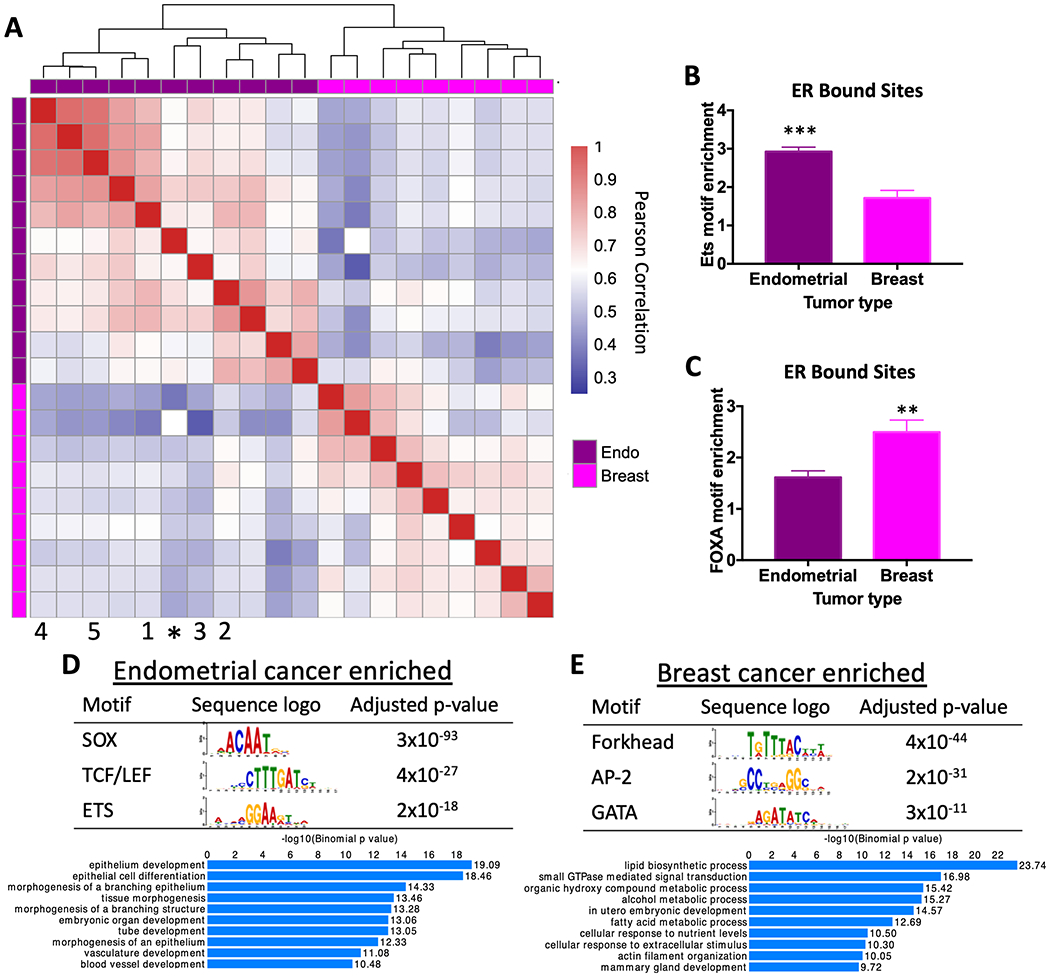
Figure 1. ER binding and associated transcription factor motifs are cancer type-specific.

A) Heatmap comparing correlation in ER genome binding in endometrial cancer and breast cancer patient samples shows that ER binding patterns are specific to cancer type. * represents Ishikawa endometrial cancer cell line. Numbers indicate PDX model (1 = EC-PDX-004, 2 = EC-PDX-005, 3 = EC-PDX-018, 4 = EC-PDX-021, and 5 = EC-PDX-026). Sequence analysis of ER ChIP-seq data shows ETS motif (p-value=0.0003, unpaired t-test) (B) and forkhead factor motif (p-value= 0.0094, unpaired t-test) (C) enrichment in ER bound sites in endometrial tumors and breast tumors. The top motifs from differential motif analysis and the top GO biological processes for nearby genes are shown for endometrial cancer-specific ER bound sites (D) and breast cancer-specific ER bound sites (E).
