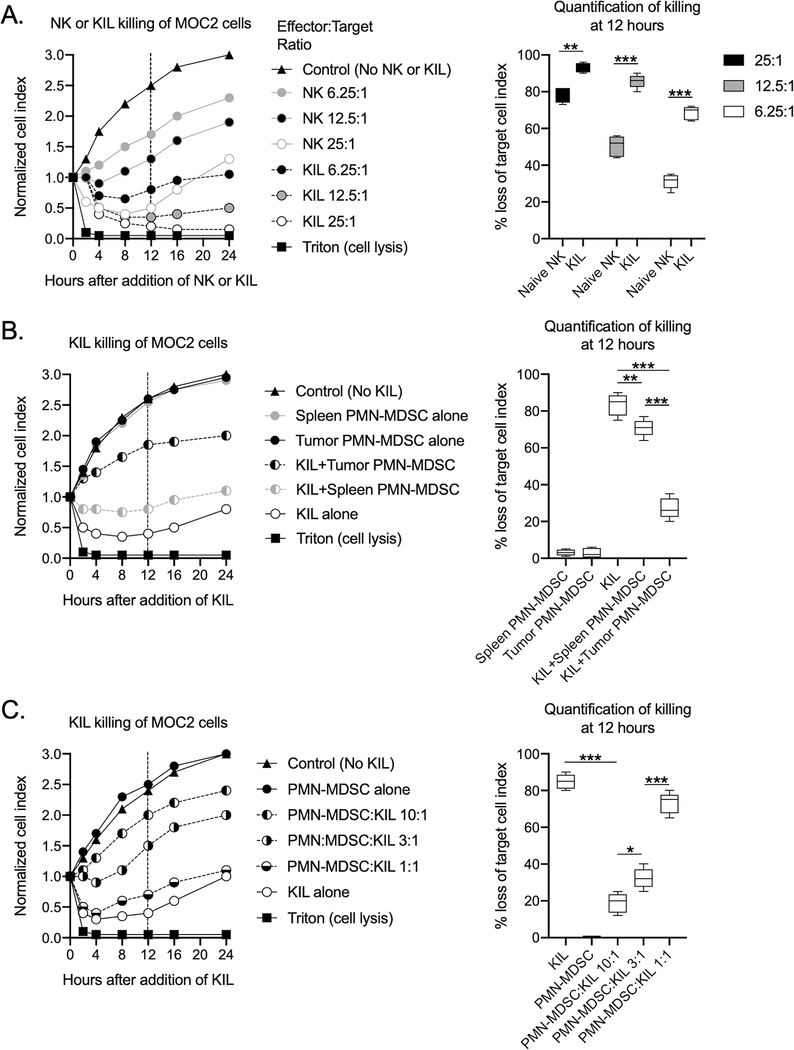
Figure 2. Tumor PMN-MDSC suppressed the effector function of KIL cells.
A, Isolated splenic NK cells and KIL were assessed for their ability to kill MOC2 tumors cells at different E:T ratios via impedance analysis. Representative impedance plot on the left, with quantification of NK killing of MOC2 cells at 12 hours on the right. B, KIL were assessed for their ability to kill MOC2 tumors cells (NK-to-MOC2 ratio of 10:1) in the presence of isolated splenic or tumor PMN-MDSC at a PMN-MDSC-to-KIL ration of 3:1 via impedance analysis. Representative impedance plot on the left, with quantification of NK killing of MOC2 cells with or without PMN-MDSC at 12 hours on the right. C, PMN-MDSC isolated from MOC2 tumors were assessed for their ability to inhibit KIL killing of MOC2 tumor cells (NK-to-MOC2 ratio of 10:1) over a range of PMN-MDSC-to-KIL ratios. Representative impedance plot on the left, with quantification of NK killing of MOC2 cells with or without PMN-MDSC at 12 hours on the right. All representative data shown from one of at least three independent experiments with similar results. *, p<0.05; **, p<0.01; ***, p<0.001

