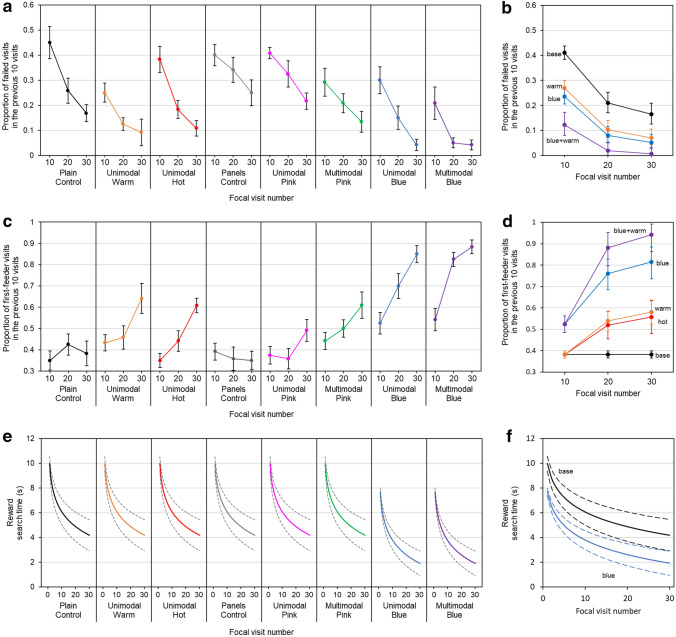
Fig. 2.
The relationships between each handling metric and experience (focal visit number) across bees that foraged on different artificial flower variants, different test groups. a The mean proportions of failed visits (proportions are calculated for the previous ten focal visits at ten, twenty and thirty focal flower visits) for bees in each test group. Error bars indicate ± one standard error of the mean. b A summary of the best fitting model for proportions of failed visits for bees foraging across all flower test groups. Points plotted are the mean proportions of failed visits for bees presented with different pattern or pattern combinations, as predicted by the best fitting model. Error bars indicate ± one standard error of the model mean estimates. c The mean proportion of first-feeder visits for bees in each test group. Error bars indicate ± one standard error of the mean. d A summary of the best fitting model for proportions of first-feeder visits for bees foraging across all flower test groups. Points plotted are the mean proportions of first-feeder visits for bees presented with different pattern or pattern combinations, as predicted by the best fitting model. Error bars indicate ± one standard error of the model mean estimates. e Solid lines indicate the mean reward search times for bees in each test group as predicted by the best fitting search time model. Dashed lines indicate ± one standard error of the model mean estimates. f A summary of the best fitting model for reward search times of bees foraging across all flower test groups. Solid lines indicate the mean reward search times for bees presented with different patterns or combinations of patterns, as predicted by the best fitting model. Dashed lines indicate ± one standard error of the model mean estimates. Across panels b, d and f, colours and labels indicate the patterns presented to bees: ‘blue + warm’ and purple colour, bees presented with both Warm temperature and Blue colour patterns together; ‘blue’ and blue colour, indicates bees presented with blue colour patterns; ‘warm’ and orange colour, bees presented with warm temperature patterns; ‘hot’ and red colour, bees presented with Hot temperature patterns; ‘base’ and black colour, bees not presented with patterns (control groups) or patterns not indicated by any other line, thus ‘base’ includes bees whose responses were indistinguishable from control bees

