Figure 1.

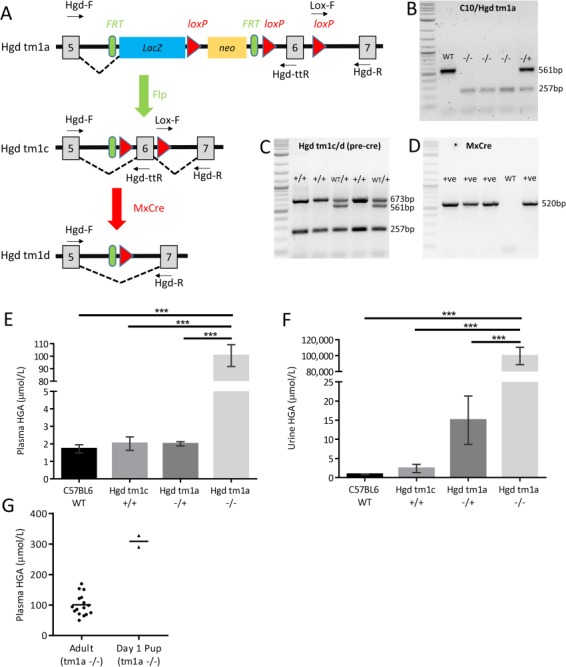
Phenotyping of Hgd tm1a mice. A–D shows genotyping of the modified HGD allele. A schematic of the modified HGD allele is shown in A. Hgd tm1a: AKU phenotype. Hgd tm1c: wild-type phenotype. Hgd tm1d: liver-specific and inducible KO. Using primer pairs Hgd-F/Hgd-ttR and Lox-F/Hgd-R, B shows the genotyping of tm1a; C shows the genotyping of tm1c (after flp recombination) and tm1d (before cre recombination). D shows the genotyping of MxCre. A 2-log DNA ladder was used in B–D. E–H show elevation of HGA in Hgd tm1a −/−. E and F show plasma and urine HGA. Plasma HGA is elevated approximately 100-fold in Hgd tm1a −/− mice (n = 16) in contrast to C57BL/6 wild-type (n = 4), Hgd tm1c +/+ (n = 7) and Hgd tm1a −/+ (n = 18) controls. Urinary HGA is elevated approximately 10 000-100 000-fold in Hgd tm1a −/− mice (n = 19) in contrast with C57BL/6 wild-type (n = 7), Hgd tm1c +/+ (n = 7) and Hgd tm1a −/+ (n = 19) controls. G shows HGA levels in Day 1 Hgd tm1a −/− pups (two pools of n = 3) in contrast with adults (n = 16). HGA = homogentisic acid. Significance: P < 0.05*, P < 0.01** and P < 0.001***. Error bars represent SEM.
