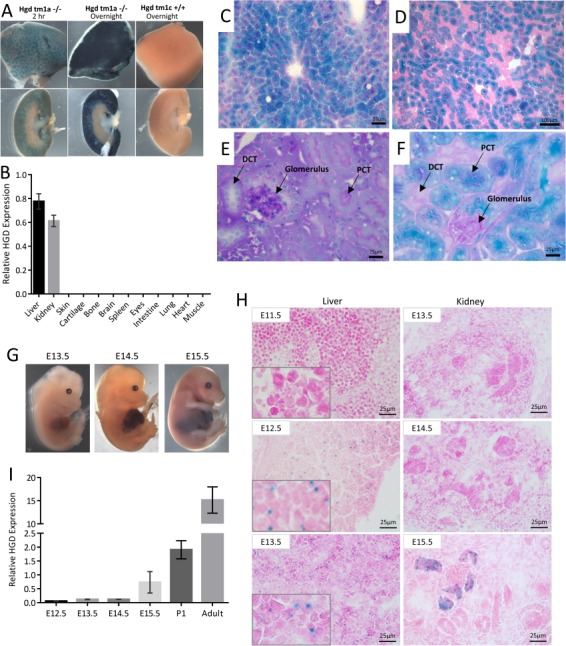
Figure 3.

Localization of HGD expression. A shows LacZ staining in adult liver (top row) and kidney (bottom row). LacZ staining (blue) represents HGD expression seen only in the liver parenchyma and kidney cortex of Hgd tm1a −/− adult mice. Control Hgd tm1c +/+ liver and kidney were LacZ-negative. B shows HGD mRNA across a variety of adult Hgd tm1d WT tissues analysed via qPCR (HGD1 primers). C–F shows frozen section staining of adult liver and kidney from Hgd tm1a −/− mice, with liver (C) and kidney cortex (D) showing specific LacZ staining after 2 h. In E, PAS staining distinguishes PCTs from DCTs by the presence of a PAS-positive dark pink/purple brush border. In F, the LacZ blue cells localize with the PAS-positive PCT cells. G–I shows HGD expression in Hgd tm1a −/− embryos. G shows whole time-mated embryo LacZ staining, with positive staining seen at E14.5 in the liver. H shows microscopic frozen section LacZ staining of liver and kidney. Positive staining is seen at E12.5 onwards in liver and from E15.5 in kidney. I shows liver HGD mRNA (HGD1 primers) in E12.5 (n = 3), E13.5 (n = 3), E14.5 (n = 4) and E15.5 (n = 3) embryos, Day 1 pups (P1) (n = 6) and adult Hgd tm1a −/− mice (n = 4). All sections: 6/7 μm. PAS: periodic acid–Schiff. PCT = proximal convoluted tubule. DCT = distal convoluted tubule. Error bars represent SEM. HGD expression normalised to 18S.
