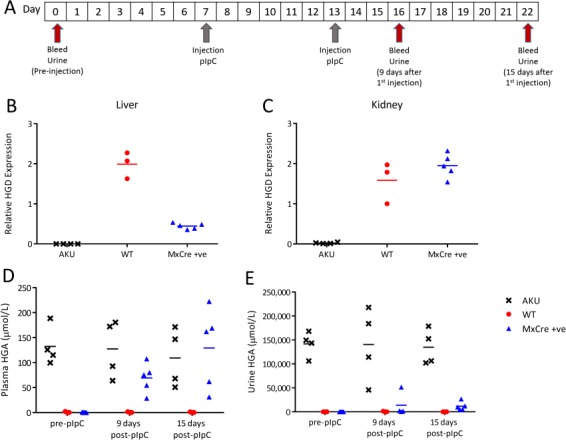
Figure 4.

Liver-specific HGD knockout, induced by pIpC injection, in Hgd tm1d MxCre +ve mice. A shows the timescale of blood and urine sampling and pIpC injections. B and C show HGD mRNA (HGD2 primers; relative to 18S) in Hgd tm1a −/− (AKU controls, n = 4), Hgd tm1d MxCre WT (wild-type controls, n = 3) and Hgd tm1d MxCre +ve mice (MxCre +ve, n = 5) in the liver and kidney, respectively, 15 days after pIpC injection. MxCre +ve mice show reduced liver, but not kidney, HGD expression in contrast to wild-type controls. D and E show plasma and urine HGA, respectively, pre-injection, 9 and 15 days after pIpC injection. Pre-injection, HGA in the plasma is not detected in MxCre +ve or WT mice. Hgd tm1a −/− mice show high HGA. Post-pIpC, plasma HGA in MxCre +ve mice is increased. Pre-injection, urinary HGA is low in MxCre +ve and WT mice in contrast to Hgd tm1a −/−. Post-pIpC, urinary HGA shows a relatively small increase in MxCre +ve mice.
