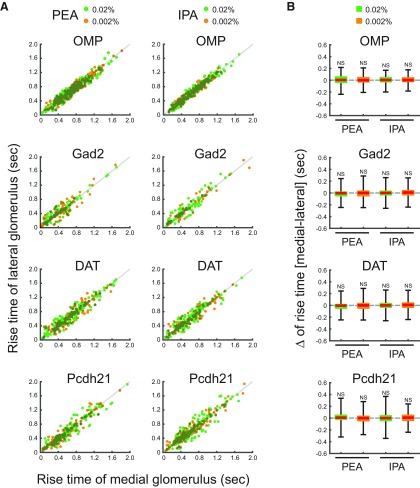
Figure 4.
Rise times of medial and lateral glomeruli. A, Scatter plots displaying the distributions of rise times of the medial and lateral glomeruli, which responded to PEA and IPA stimuli. x and y axes indicate rise times of medial and lateral glomerular responses, respectively. Individual green and orange dots indicate single trial data of 0.02% and 0.002% PEA or IPA. Gray lines indicate the equal rise time points of medial and lateral glomerular responses. B, Box plots displaying the distributions of the differences of rise times between medial and lateral glomerular responses to 0.02% and 0.002% PEA or IPA. Red horizontal lines in each box indicate the medians. Quartiles are shown as whiskers. NS, not significant (two-tailed paired Student’s t test).

