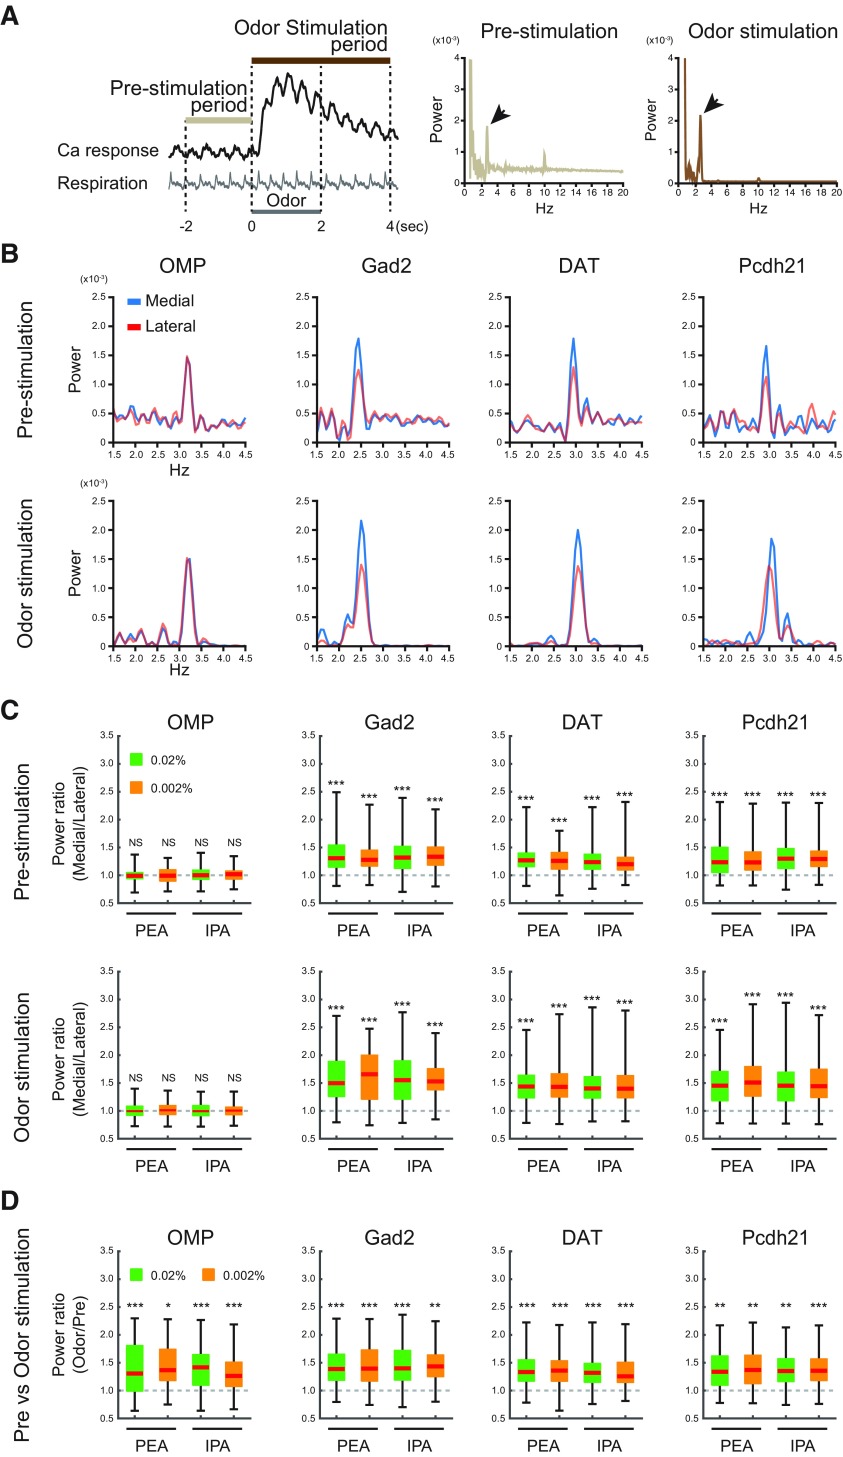
Figure 7.
Respiration-locked calcium fluctuations of medial and lateral glomeruli. A, Schematic illustration of data collection time points and power spectral analysis. The prestimulation and odor stimulation periods are defined in left panel. Middle and right panels are representative examples of power spectral analyses with large frequency ranges in single trials. Respiration-locked fluctuations of calcium signals were prominently observed at 2–4 Hz (arrows). B, Representative results of power spectral analyses of calcium signals during prestimulation (upper rows) and odor stimulation (lower rows) periods in neurons from GCaMP-expressing OMP-Cre, Gad2-Cre, DAT-Cre, and Pcdh21-Cre mice. The calcium response traces of these spectra are shown as 0.02% IPA response signals in Fig. 2B. Blue and red traces indicate medial and lateral glomeruli, respectively (see also Extended Data Fig. 7-1). C, Comparisons of power spectra between the homologous glomeruli during prestimulation (upper rows) and odor stimulation (lower rows) period in neurons from OMP-Cre, Gad2-Cre, DAT-Cre, and Pcdh21-Cre mice. The ratios of peak powers were calculated by dividing the medial glomerular power by the lateral glomerular power in each trial. The powers were calculated after correction for the white-noise background (see Materials and Methods). D, Comparisons of peak power between the prestimulation and odor stimulation periods of the same glomeruli in each cell type. The power ratios were calculated by dividing the power value in the odor stimulation period by that in the prestimulation period after the subtraction of background level (see text); *p < 0.05, **p < 0.01, ***p < 0.001 two-tailed paired Student’s t test.

