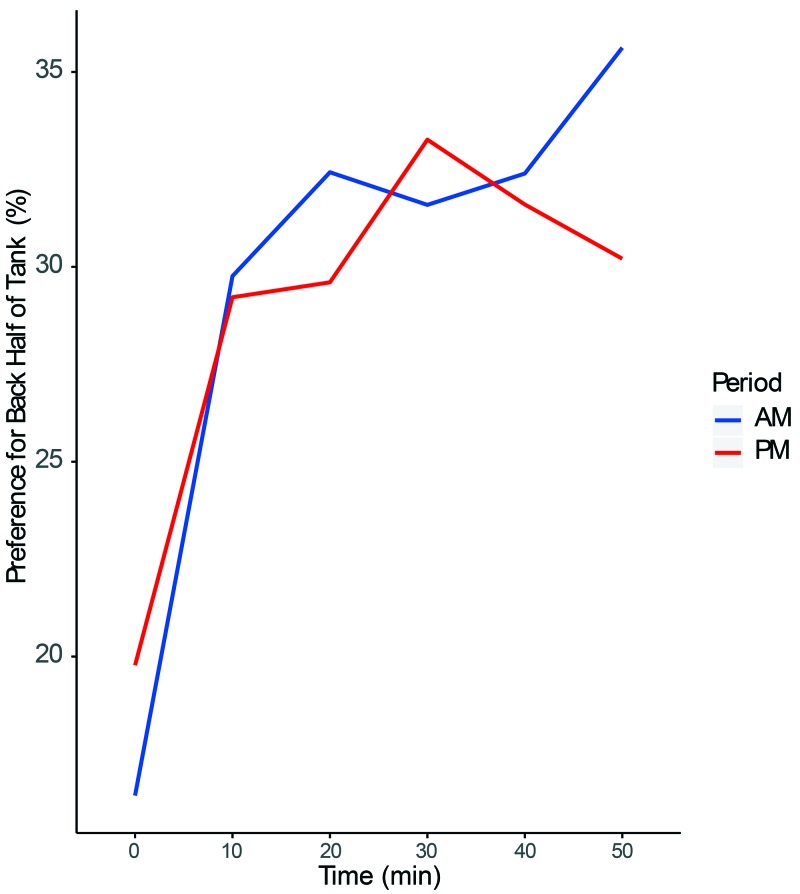
Figure 5.
Average percentage of time spent by the zebrafish (n = 10) in the back half of the tank over the course of the recorded hour, controlled for all enrichments including baseline. The time scale indicates the 10-min intervals in which the first 10 s of each interval were scored during the hour-long video observation. Time interval during the hour of observation had a significant (P < 0.00001) effect on fish location in the tank. Significance was determined by using mixed-effect linear regression examining the effect of time on preference.

