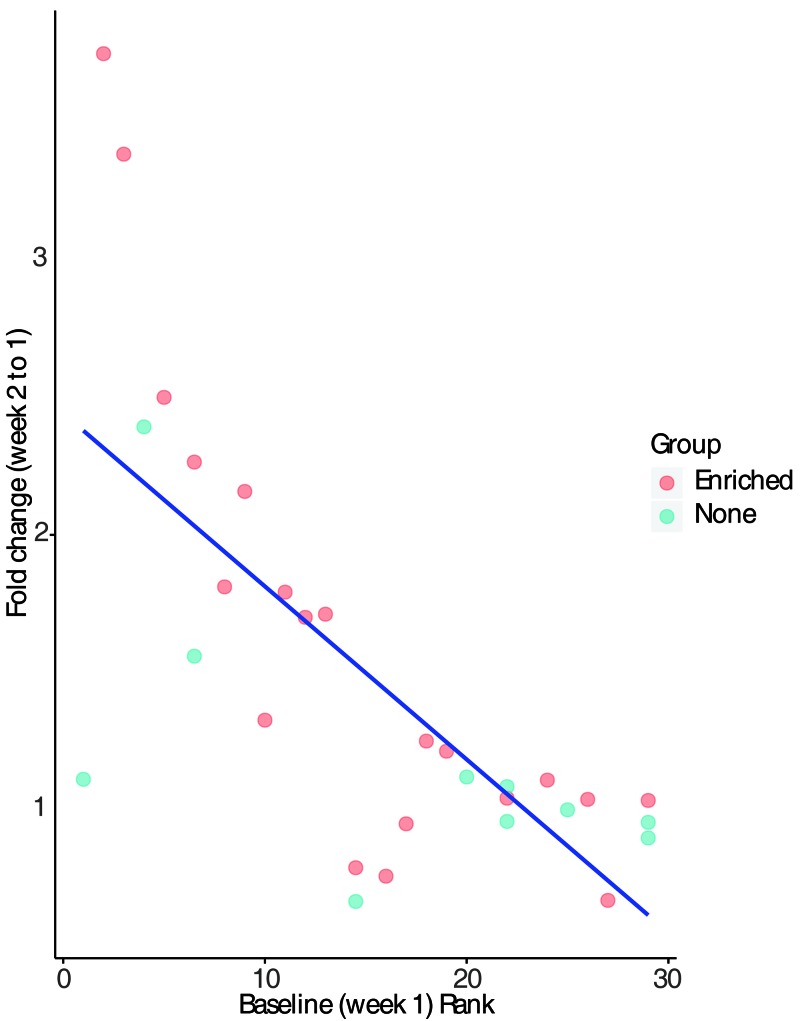
Figure 8.
Effect of baseline (week 1) side preference on social side preference during week 2. Each fish was ranked (0 to 30) from least to greatest preference for the assigned social side of the tank during week 1, prior to exposure to neighbor tanks. A higher rank indicates greater side preference. Fold change in preference for the social side during the experimental week (week 2) relative to the baseline week (week 1) was calculated by dividing the value for week 2 by that for week 1. Spearman correlation between baseline rank and fold change demonstrated an inverse correlation (Spearman r = –0.733, P = 4.06 × 10−06).

