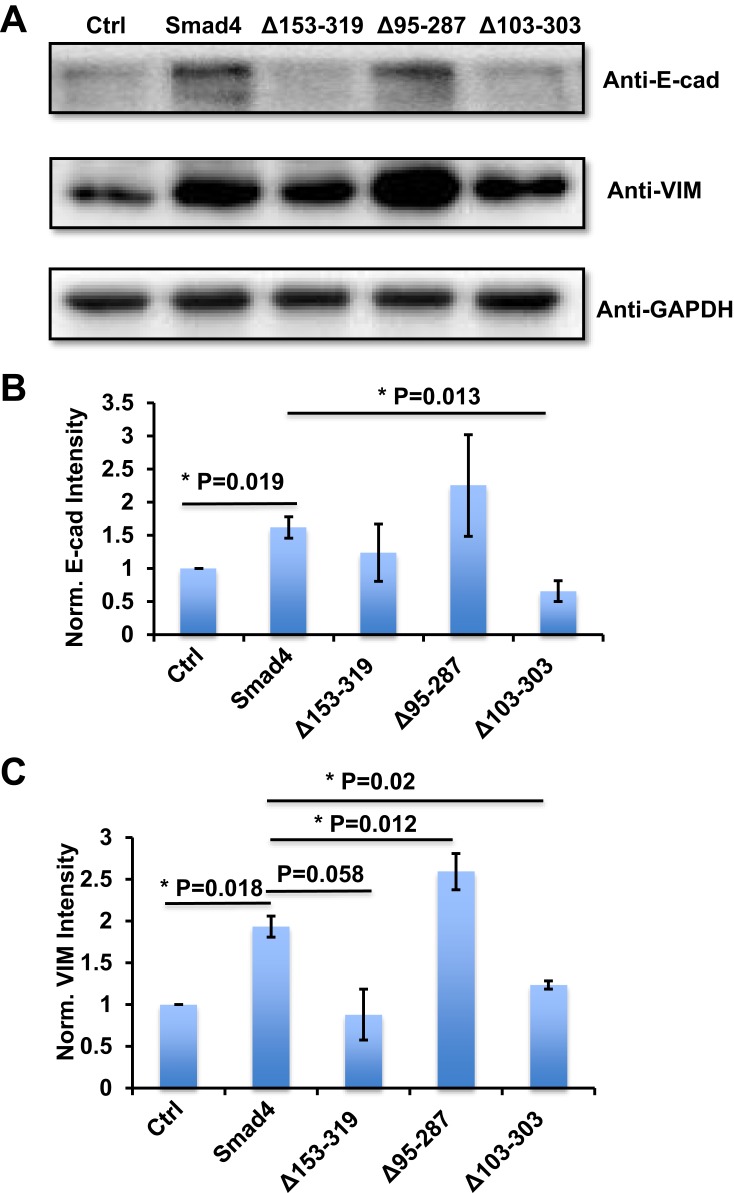
Figure 3.
Variants of Smad4 affect E-cad and VIM protein expression in A549 cells. (A) Representative images show E-cad and VIM protein expression in A549 cells that recombinantly express wildtype Smad4 or its variants as indicated. (B) Bar graphs to show the intensity-based quantification of E-cad expression in panel A. (C) Bar graphs show the intensity-based quantification of VIM expression in panel A. n=4, Error bars: Mean±SD. *P<0.05.

