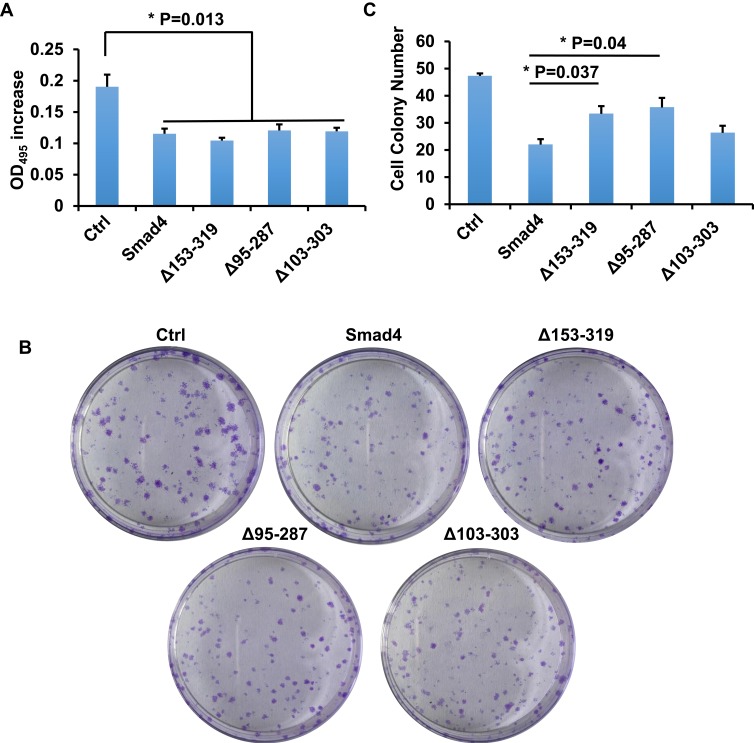
Figure 5.
Smad4 variants affect the proliferation of A549 cells. (A) Bar graphs show the OD495 increment of A549 cells that recombinantly express wild type Smad4 or its variants as indicated. (B) Representative images show colony formation of A549 cells that recombinantly express wildtype Smad4 or its variants as indicated. (C) Bar graphs show cell colony numbers of A549 cells as indicated in panel B. n=3, Error bars: Mean±SD. *P<0.05.

