-
A
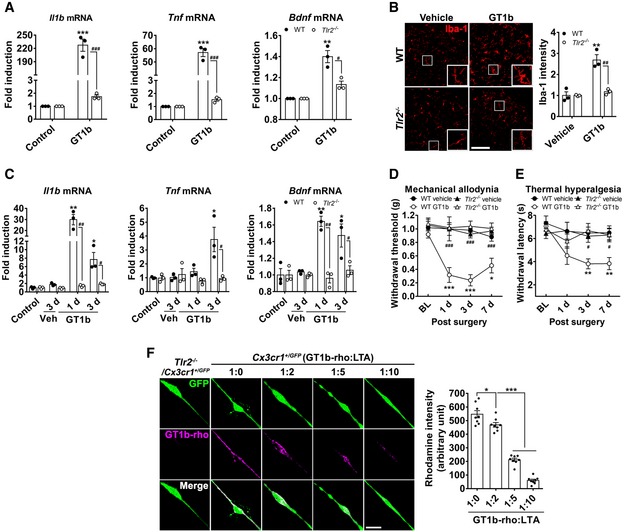
Glial cells cultured from WT and Tlr2
−/− mice were stimulated with 10 μg/ml of GT1b for 3 h, and transcript levels were measured using real‐time RT–PCR. Data are represented as mean ± SEM (Student's t‐test, **P < 0.01; ***P < 0.001, vs. control in WT, #
P < 0.05; ###
P < 0.001, vs. Tlr2
−/− mice).
-
B
Lumbar spinal cord sections prepared from WT (n = 3/group) and Tlr2
−/− mice (n = 3/group) 1 day after intrathecal injection of GT1b (25 μg/5 μl in saline) were immunostained with Iba‐1 antibody, and representative images are shown (scale bar, 100 μm). Vehicle‐injected mice served as controls. The fluorescence intensity of Iba‐1‐IR was measured and presented as the fold induction compared to the corresponding control. Data are represented as mean ± SEM (Student's t‐test, **P < 0.01, vs. control in WT, ##
P < 0.01, vs. Tlr2
−/− mice).
-
C
Transcript levels were measured using real‐time RT–PCR in L4‐5 spinal cord tissues of WT and Tlr2
−/− mice after intrathecal injection of GT1b (25 μg/5 μl, n = 3/group) or vehicle. Data are represented as mean ± SEM (n = 3/group, Student's t‐test, *P < 0.05; **P < 0.01, vs. control in WT, #
P < 0.05; ##
P < 0.01, vs. in Tlr2
−/− mice).
-
D, E
Mechanical allodynia (D) and thermal hyperalgesia (E) were assessed in WT (vehicle, n = 5; GT1b, n = 5) and Tlr2
−/− mice (vehicle, n = 6; GT1b, n = 7) after intrathecal injection of GT1b (25 μg/5 μl) or vehicle. Data are represented as mean ± SEM (one‐way ANOVA, *P < 0.05; **P < 0.01; ***P < 0.001, vs. vehicle in WT, #
P < 0.05; ##
P < 0.01; ###
P < 0.001, vs. WT GT1b group in each time point).
-
F
Primary microglia cultured from Cx3cr1
+/GFP and Tlr2
−/−/Cx3cr1
+/GFP mice were incubated with 5 μg/ml of GT1b‐rhodamine in the presence or absence of LTA (n = 8/group), and representative images are shown (scale bar, 20 μm). The fluorescence intensity of GT1b‐rhodamine was measured and presented as mean ± SEM (Student's t‐test, *P < 0.05; ***P < 0.001).

