-
A
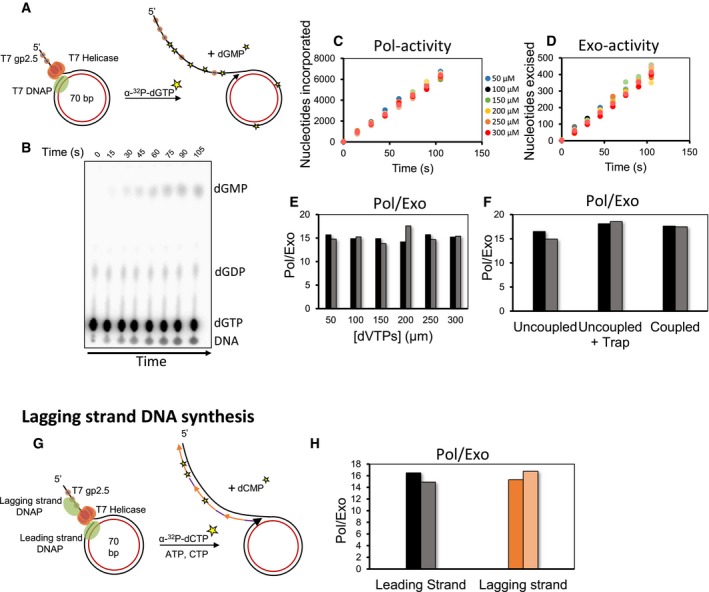
The experimental design to simultaneously measure Pol‐ and Exo‐activities during leading strand synthesis. T7 replisome was assembled on a minicircle DNA substrate that supports efficient rolling circle leading strand synthesis. Asterisks represent incorporated and excised radiolabeled nucleotides.
-
B
Representative TLC image shows the locations of nascent DNA from the Pol‐activity, remaining dGTP substrate, dGDP contamination, and excised dGMP from the Exo‐activity.
-
C, D
Time courses of Pol‐activity (C) and Exo‐activity (D) expressed as moles of nucleotides incorporated and excised per mole of substrate DNA used. Experiments were performed at a constant 500 μM dTTP concentration and increasing concentration of dVTPs.
-
E
Pol/Exo ratios were calculated from the slopes of linear fits of data in (C and D).
-
F
Pol/Exo ratio during leading strand synthesis in the absence and presence of a protein trap and leading strand synthesis coupled with lagging strand synthesis. 800 nM trap was added at 30 s after reaction initiation. Coupled synthesis reactions were carried out in the presence of priming nucleotides, ATP and CTP.
-
G
Lagging strand reactions were performed in the presence of ATP and CTP and α‐32P‐dCTP.
-
H
Pol/Exo ratio during leading and lagging strand reactions is compared. Pol/Exo‐data for uncoupled leading strand synthesis from (F) are used here for comparison.
Data information: Circles in two shades of the same color show data from two individual experiments. Bars represent data from two individual experiments.

