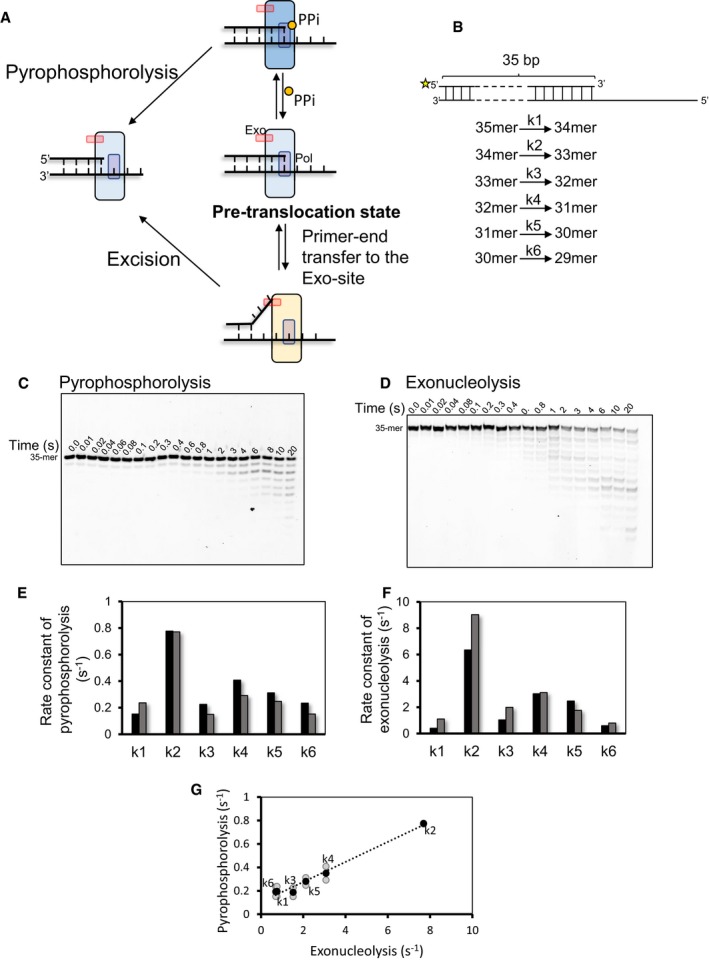
Figure 4. Primer‐end transfer from polymerase to exonuclease site initiates from the pre‐translocation state.

-
ASchematic of DNAP catalyzing pyrophosphorolysis and exonuclease reactions from the pre‐translocation state. PPi (yellow circle) binding to the pre‐translocation state in the “fingers‐closed” conformation (dark blue DNAP) results in dNTP synthesis and shortening of the primer‐end by one nucleotide. The primer‐end can be transferred to exonuclease site in the “fingers‐open” conformation (light blue DNAP), resulting in excision reaction and shortening of the primer‐end by one nucleotide.
-
BPrimer–template DNA substrate used for determining the pre‐steady‐state kinetics of pyrophosphorolysis and exonucleolysis. The asterisk at 5′ end of the primer is fluorescein label.
-
C, DPyrophosphorolysis reactions performed with exo− T7 DNAP and pyrophosphate (C) and excision reactions performed with exo+ T7 DNAP (D) quenched at stated time points and analyzed on 24% denaturing polyacrylamide gels.
-
E, FRate constants for pyrophosphorolysis (E) and excision reactions (F).
-
GCorrelation between rates of pyrophosphorolysis and exonucleolysis.
