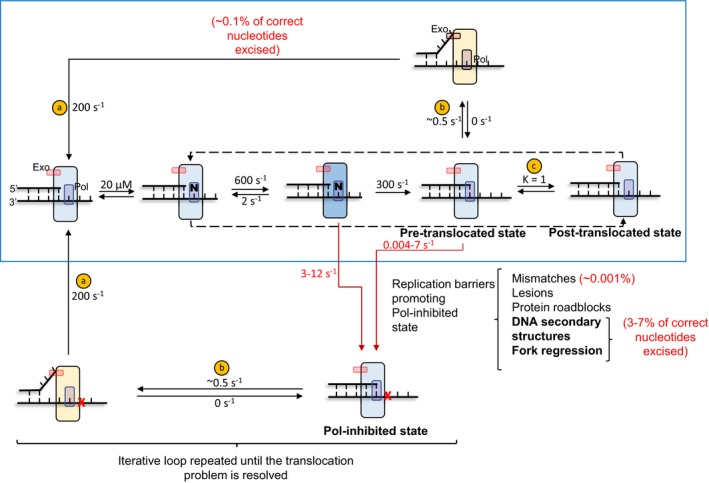
Figure EV5. Fitting of data to translocation‐regulated model of active‐site switching.

The model is showing the normal DNA synthesis pathway (in the blue selection) and the proposed alternative route via Pol‐inhibited states. The values of kinetic parameters used for fitting data in the two models tested in the result section (Fig 5) are shown for each step. Values in steps “a” and “c” are taken from Donlin et al (1991) and Lieberman et al (2014), respectively. Rest of the values are from Johnson (2010). Step “b” is sequence‐dependent and was arbitrarily put. The fittings were performed with the chi‐square threshold limit of 0.67 set in FitSpace module of Kintek Explorer (Johnson et al, 2009a). The range of the floated parameters determined from the fitting of the data to model 2 (presented in Fig 5A) is in red font.
