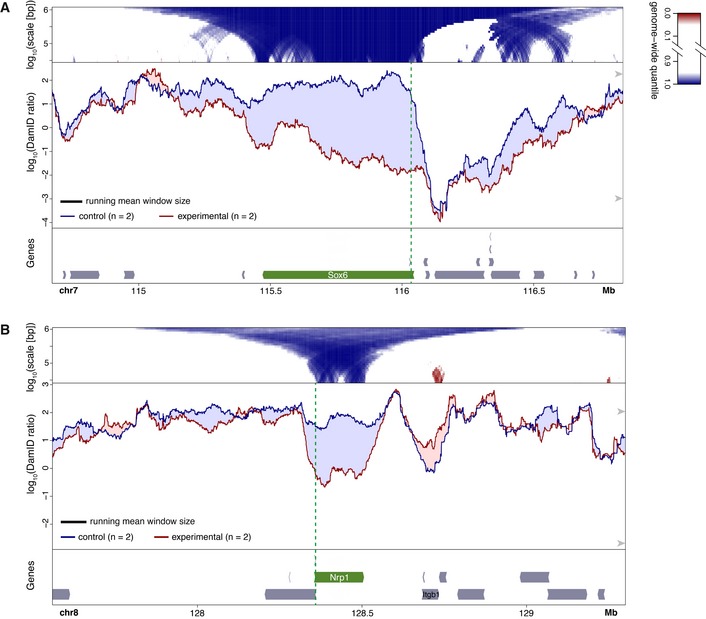
Figure 1. Changes in NL interactions of Sox6 (A) and Nrp1 (B) in mES cells after activation by TALE‐VP64.

-
A, BBottom panels: gene annotation track (mm10); the activated gene is marked in green and the location of the TALE‐VP64 target sequence is shown by the vertical dashed green line. Middle panels: DamID tracks of NL interactions in control cells (“control”, blue line) and cells expressing TALE‐VP64 (“experimental”, red line). n indicates the number of independent biological replicates that were combined. Noise was suppressed by a running mean filter of indicated window size. Shading between the lines corresponds to the color of the sample with the highest value. Arrowheads on the right‐hand side mark the 5th and 95th percentiles of genome‐wide DamID values. Top panels: domainograms; for every window of indicated size (vertical axis) and centered on a genomic position (horizontal axis), the pixel shade indicates the ranking of the change in DamID score (experimental minus control) in this window compared to the genome‐wide changes in DamID scores across all possible windows of the same size. Blue: DamID score is highest in control samples; red: DamID score is highest in experimental samples (color key on the right of panel (A)). In (A) activation of Sox6 was the experimental perturbation, activation of Nrp1 (which is located on a different chromosome) served as control; in (B) activation of Nrp1 was the experimental condition and activation of Sox6 served as control.
