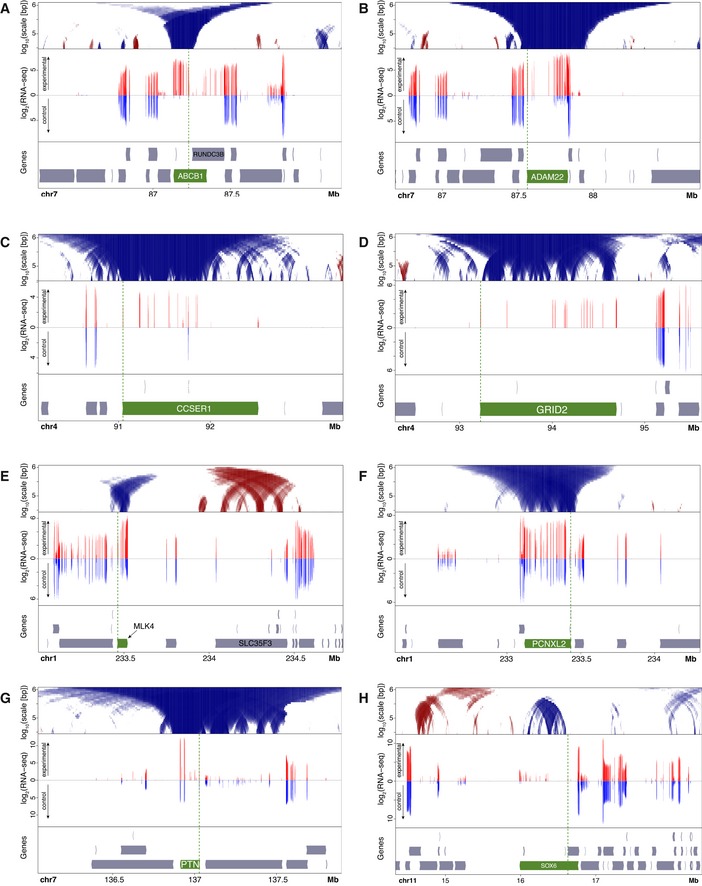
Top panels: domainograms showing changes in NL interactions around genes activated by CRISPRa. Domainograms are same as in Fig
2C. Middle panels: log
2 mRNA expression (normalized read counts in 50 bp bins) as determined by mRNA‐seq of CRISPRa‐activated cells (red, upward
y‐axis) compared to untransfected control cells (blue, downward
y‐axis). Note that only introns give detectable reads. Data are average of two independent replicate experiments each. Bottom panels: gene annotation track. Each CRISPRa‐targeted gene is highlighted in green; targeted promoters are marked by vertical green dotted line.

