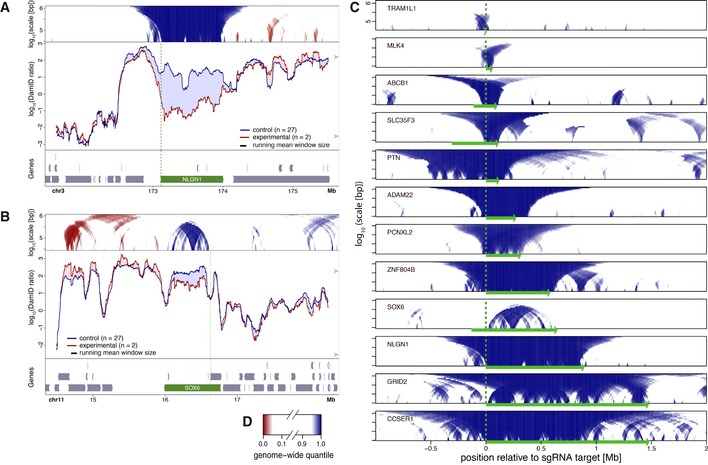
Figure 2. Local NL detachment caused by gene activation by CRISPRa in human RPE‐1 cells.

-
A, BPlots as in Fig 1, showing changes in lamin B1 DamID signals upon CRISPRa activation of NLGN1 (A) and SOX6 (B). Control cells were treated either without sgRNA or with one of various sgRNAs targeting promoters on different chromosomes. Vertical green dotted lines mark the position of the sgRNA target sequence.
-
CDomainograms showing regions with reduced NL interactions around 12 genes individually activated by CRISPRa. Genomic regions are aligned by the respective sgRNA target positions and oriented so that the activated genes are all transcribed from left to right. Corresponding DamID traces are shown in Figs 2A and B, and 4, 5, EV2, EV4.
-
DColor key of domainograms in (A–C). Increases in NL interactions (red) are not shown in (C).
