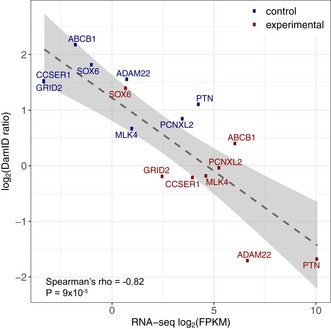
Figure 3. Inverse correlation between NL interaction and gene expression level in human RPE‐1 cells.

Average DamID values plotted against average expression levels of eight genes activated by CRISPRa (red; n = 2) or in control cells that were treated either without sgRNA or with one of various sgRNAs targeting promoters on different chromosomes (blue; n ranging from 19 to 27).
