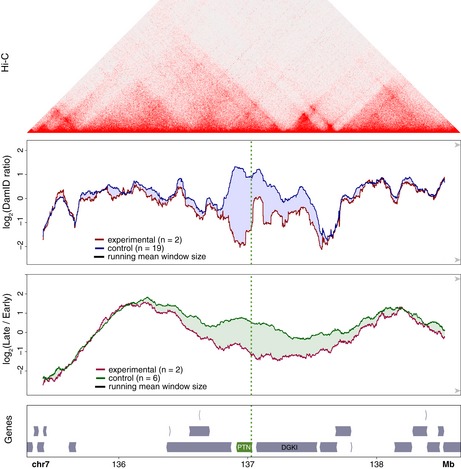
Figure EV3. Comparison of DamID and replication timing patterns around the PTN gene to Hi‐C data.

DamID data and gene annotation track of Fig 4C (three bottom panels) aligned to Hi‐C data from untreated human RPE‐1 cells (top panel). Hi‐C data are from (Darrow et al, 2016) (Data ref: Darrow et al, 2016).
