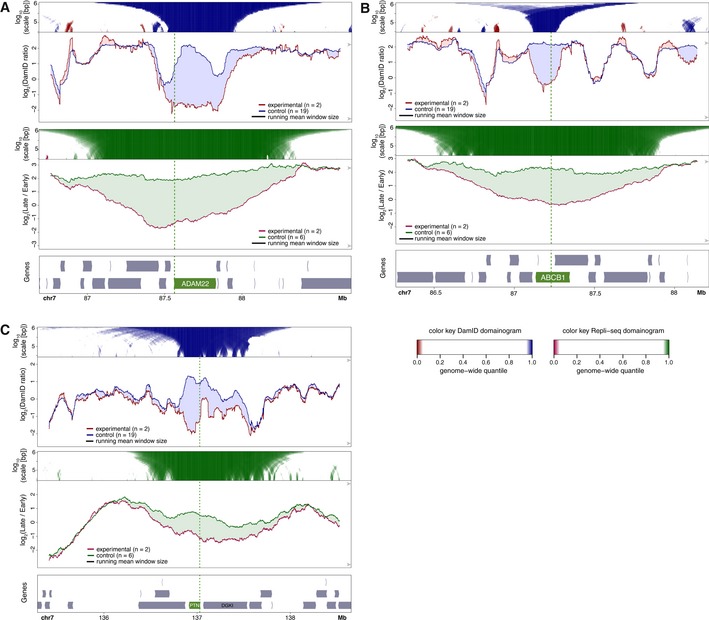
Figure 4. NL interactions and replication timing around activated genes.

-
A–CCRISPRa activation of ADAM22 (A), ABCB1 (B), and PTN (C) in human RPE‐1 cells. Top panels visualize DamID data similar to Fig 2A and B. Middle panels show maps of replication timing at the same resolution and in the same plotting style as panels, except that different colors are used as indicated. Bottom panels show gene track, with activated gene highlighted in green.
