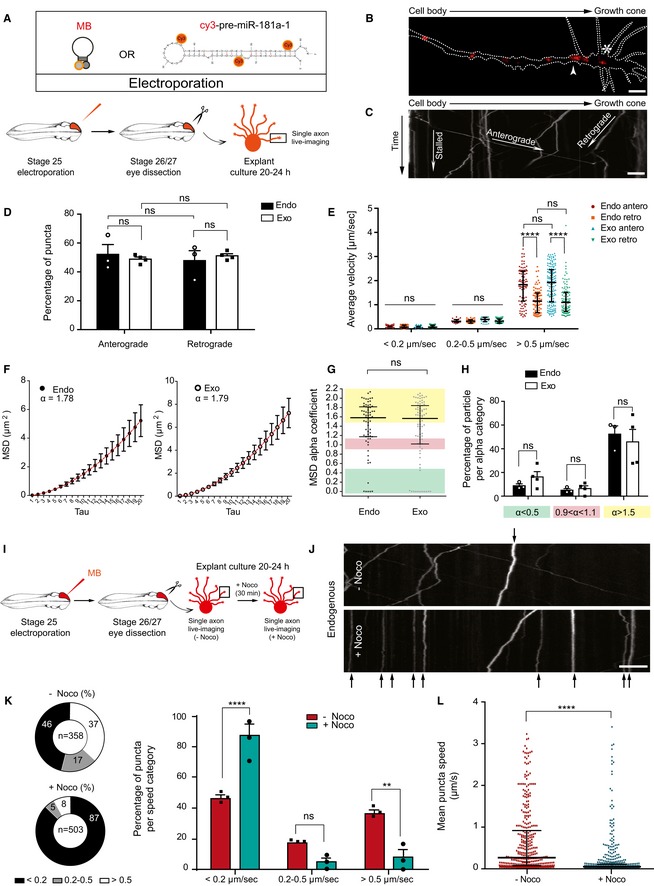
Schematic representation of the experimental paradigm. Concentrations used are as follows: 5 μM MB; 200–250 ng/μl cy3‐pre‐miR‐181a‐1. MB, molecular beacon.
Representative image of a single distal RGC axon from MB‐electroporated retina. Growth cone wrist and central domain are indicated with white arrow and star, respectively. Dashed white line delineates the axon. MB, molecular beacon. Scale bars: 5 μm.
Illustrative kymograph. Scale bars: 5 μm.
Frequency distribution (in percentage) of MB (endo) and cy3‐pre‐miR‐181a‐1 (exo) puncta along the RGC axon shaft. Each data point corresponds to one independent experiment. Total number of puncta and axons analyzed is as follows: 353 puncta and 20 axons (endo); 484 puncta and 29 axons (exo). n = 3 (endo) and n = 4 (exo) independent experiments. Values are mean ± SEM. MB, molecular beacon; ns, not significant.
Average velocity of MB (endo) and cy3‐pre‐miR‐181a‐1 (exo) puncta. Each data point corresponds to one punctum. Total number of puncta and axons analyzed is as follows: 353 puncta and 20 axons (endo); 484 puncta and 29 axons (exo). n = 3 (endo) and n = 4 (exo) independent experiments. Values are median with interquartile range. MB, molecular beacon; ns, not significant; antero, anterograde movement; retro, retrograde movement.
MSD data for MB (endo) and cy3‐pre‐miR‐181a‐1 (exo) tracked particles were fitted with an anomalous diffusion model and α thus calculated (red). Total number of particles and axons analyzed is as follows: 67 particles and 20 axons (endo); 82 particles and 29 axons (exo). n = 3 (endo) and n = 4 (exo) independent experiment. Values are mean ± SEM. MB, molecular beacon.
MSD alpha‐coefficient distribution for each single MB (endo) and cy3‐pre‐miR‐181a‐1 (exo) tracked particle. Each data point corresponds to one particle. Total number of particles and axons analyzed is as followed: 67 particles and 20 axons (endo); 82 particles and 29 axons (exo). n = 3 (endo) and n = 4 (exo) independent experiments. Values are median with interquartile range. MB, molecular beacon; ns, not significant.
Relative frequency distribution (percentage) of MB (endo) and cy3‐pre‐miR‐181a‐1 (exo) tracked particles. Each data point corresponds to one independent experiment. Total number of particles and axons analyzed is as follows: 67 particles and 20 axons (endo); 82 particles and 29 axons (exo). n = 3 (endo) and n = 4 (exo) independent experiments. Values are mean ± SEM. MB, molecular beacon; ns, not significant.
Schematic representation of the experimental paradigm. Five micromolar MB was electroporated. MB, molecular beacon.
Representative kymographs before nocodazole (top panel; −Noco) and 30 min after 2.4 μM Noco bath application (bottom panel; +Noco). Stationary puncta in both panels are indicated with black arrows. Scale bars: 5 μm.
Frequency distribution (in percentage) of MB punctum speed. Each data point corresponds to one independent experiment. Total number of puncta and axons analyzed is as follows: 358 puncta and 25 axons (−Noco); 503 puncta and 34 axons (+Noco). n = 3 independent experiments. Values are mean ± SEM. MB, molecular beacon; ns, not significant; Noco, nocodazole.
Frequency distribution of MB punctum speed. Each data point corresponds to one punctum. Total number of puncta and axons analyzed is as follows: 358 puncta and 25 axons (−Noco); 503 puncta and 34 axons (+Noco). n = 3 independent experiments. Values are median with interquartile range. MB, molecular beacon; ns, not significant; Noco, nocodazole.
< 0.0001. Two‐way ANOVA followed by Sidak's multiple comparison
test (D, K). Two‐way ANOVA followed by Tukey's multiple comparison
test (E, H). Data were not normally distributed (Shapiro–Wilk test). Two‐tailed Mann–Whitney test (G, L).

