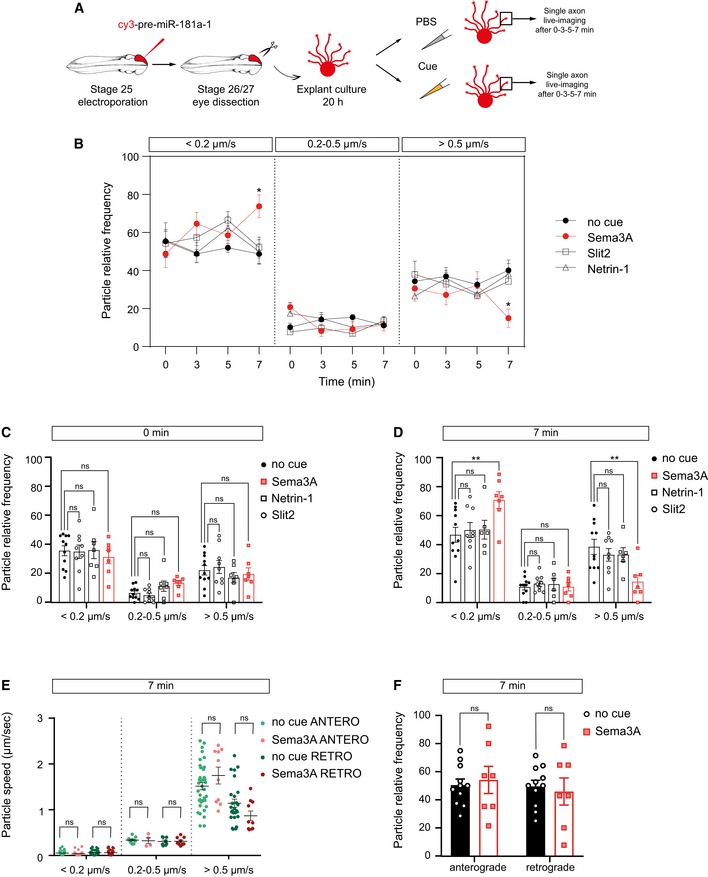
Figure EV3. The fast transport of pre‐miR‐181a‐1 is decreased upon Sema3A exposure.

-
ASchematic representation of the experimental protocol. Two hundred to two hundred fifty nanogram per microliter cy3‐pre‐miRNA‐181a‐1, 100 ng/ml Netrin‐1, 200 ng/ml Sema3A, and 200 ng/ml Slit2 or no cue control (1× PBS) were bath applied to the cultures for up to 7 min. Zero minute in the graph corresponds to time‐lapse movies acquired before treatment. The same axon was analyzed for each condition at 0, 3, 5, and 7 min.
-
B–DFrequency distribution of tracked puncta. Each data point corresponds to one axon. Total number of puncta analyzed is as follows: 244, 221, 211, and 158 (no cue at 0, 3, 5, and 7 min); 231, 245, 203, and 178 (Slit2 at 0, 3, 5, and 7 min); 133, 160, 119, and 85 (Netrin‐1 at 0, 3, 5, and 7 min); 125, 134, 106, and 111 (Sema at 0, 3, 5, and 7 min). Total number of axons analyzed is as follows: 11 (no cue), 9 axons (Slit2), 7 axons (Netrin‐1), and 7 axons (Sema3A). n = 6 (no cue), n = 3 (Slit, Netrin), and n = 4 (Sema) independent experiments. Values are mean ± SEM. ns, not significant.
-
EAverage velocity of puncta. Each data point corresponds to one axon. Total number of puncta and axons analyzed is as follows: 150 puncta and 11 axons (no cue); 99 puncta and 7 axons (Sema3A). n = 4 (Sema3A) and n = 6 (no cue) independent experiments. Values are mean ± SEM. ns, not significant.
-
FFrequency distribution of tracked puncta. Each data point corresponds to one axon. Total number of puncta and axons analyzed is as follows: 150 puncta and 11 axons (no cue); 99 puncta and 7 axons (Sema). n = 4 (Sema) and n = 6 (no cue) independent experiments. Values are mean ± SEM. ns, not significant.
