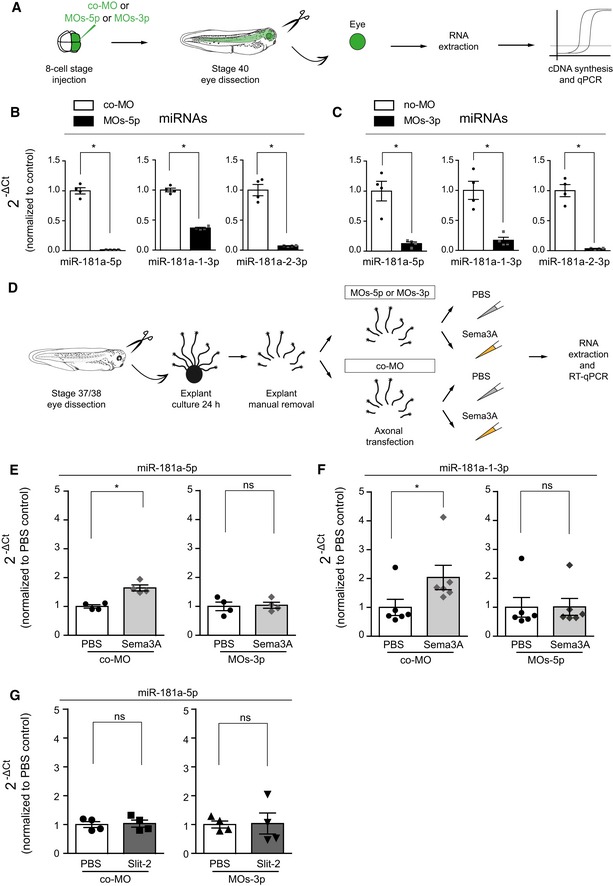
Figure EV4. Morpholino mix validation.

-
ASchematic representation of the experimental paradigm. co‐MO, control morpholino.
-
B, CQuantification of the expression levels of miRNAs using the 2−ΔCt method and U6 as normalizer. Concentrations used are as follows: 150–200 μM co‐MO or MOs‐5p or MOs‐3p. Data are presented normalized to co‐MO. Each data point corresponds to one independent experiment. n = 4 independent experiments. Values are mean ± SEM. co‐MO, control morpholino.
-
DSchematic representation of the experimental paradigm. co‐MO, control morpholino.
-
E–GQuantification of the expression levels of miR‐181a‐5p (E, G) and miR‐181a‐1‐3p (F) and using the 2−ΔCt method and U6. Concentrations used are as follows: 2 μM MOs‐5p or MOs‐3p or co‐MO, 200 ng/ml Sema3A or Slit‐2. Data are presented normalized to PBS control. Each data point represents a single RT–qPCR. n = 4 (E, G) and n = 6 (F) independent experiments. Values are mean ± SEM. ns, not significant
