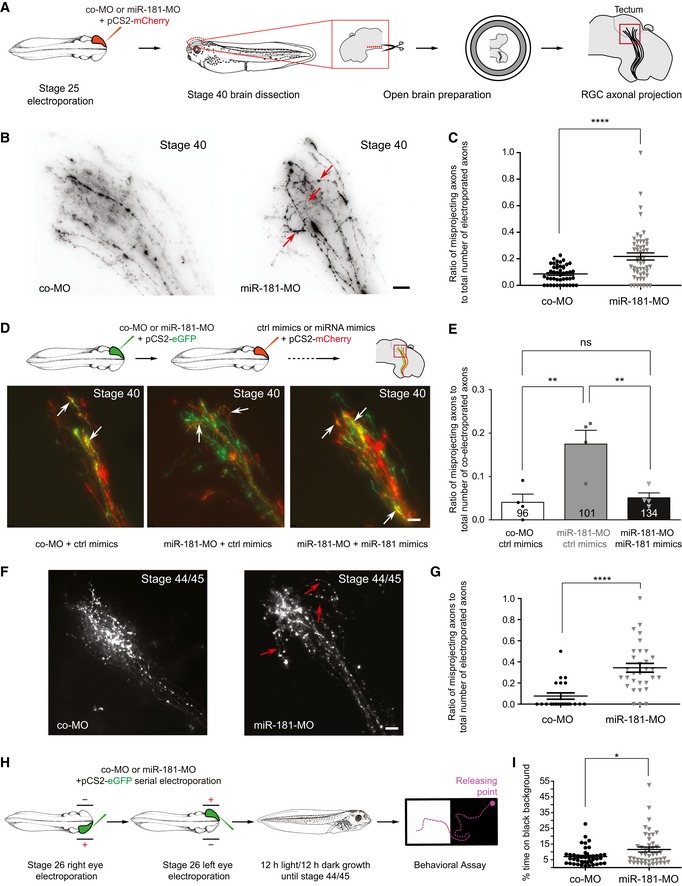
Schematic representation of the experimental paradigm. Concentrations used are as follows: 0.5 μg/μl pCS2‐mCherry plasmid; 250 μM miR‐181‐MO or control MO cocktail. co‐MO, control morpholino.
Representative images of RGC axons within the optic tectum. A subset of aberrantly projecting axons are indicated (red arrows). Note that a few straying axons are always observed within the wild‐type tectum. co‐MO, control morpholino. Scale bars: 20 μm.
Quantification of misprojecting axons. Each data point corresponds to one brain. Total number of brains analyzed is as follows: 45 brains (co‐MO) and 52 brains (miR‐181‐MO). n = 4 independent experiments. Values are mean ± SEM. co‐MO, control morpholino.
Schematic representation of the experimental paradigm. Concentrations used are as follows: 0.5 μg/μl pCS2‐mCherry or pCS2‐eGFP plasmids; 250 μM miR‐181‐MO or control MO cocktail; 50 μM miR‐181 or control mimics (top). Representative images of RGC axons within the optic tectum. White arrows indicate axons targeted both by MO (green) and by miRNA mimics (red; bottom). co‐MO, control morpholino. Scale bars: 20 μm.
Quantification of misprojecting axons. The number reported on the bars is the total number of co‐electroporated axons. Note how miR‐181 mimics rescued aberrant misprojection of morphant axons in vivo. Each data point corresponds to one independent experiment. Total number of axons and brains analyzed is as follows: 96 axons and 4 brains (co‐MO + ctrl mimics); 101 axons and 4 brains (miR‐181‐MO + ctrl mimics), 134 axons and 4 brains (miR‐181‐MO + miR‐181 mimics). n = 4 independent experiments. Values are mean ± SEM. co‐MO, control morpholino; ns, not significant.
Representative images of RGC axons within the optic tectum. A subset of aberrantly projecting axons are indicated (red arrows). Note that a few straying axons are always observed within the wild‐type tectum. co‐MO, control morpholino. Scale bars: 20 μm.
Quantification of misprojecting axons. Each data point corresponds to one brain. Total number of brains analyzed is as follows: 21 brains (co‐MO) and 31 brains (miR‐181‐MO). n = 3 independent experiments. Values are mean ± SEM. co‐MO, control morpholino.
Schematic representation of the experimental paradigm. Concentrations used are as follows: 0.5 μg/μl pCS2‐eGFP plasmid; 250 μM miR‐181‐MO or control MO cocktail. co‐MO, control morpholino.
Frequency (in percentage) of the amount of time embryos spent on black background. Each data point corresponds to one embryo. Total number of embryos analyzed is as follows: 43 embryos (co‐MO) and 45 embryos (miR‐181‐MO). n = 4 independent experiments. Values are mean ± SEM. co‐MO, control morpholino.
< 0.001. Data were not normally distributed (Shapiro–Wilk test). Two‐tailed Mann–Whitney test (C, G, I). Data were normally distributed (Shapiro–Wilk test). One‐way ANOVA followed by Tukey's multiple comparison
test (E).

