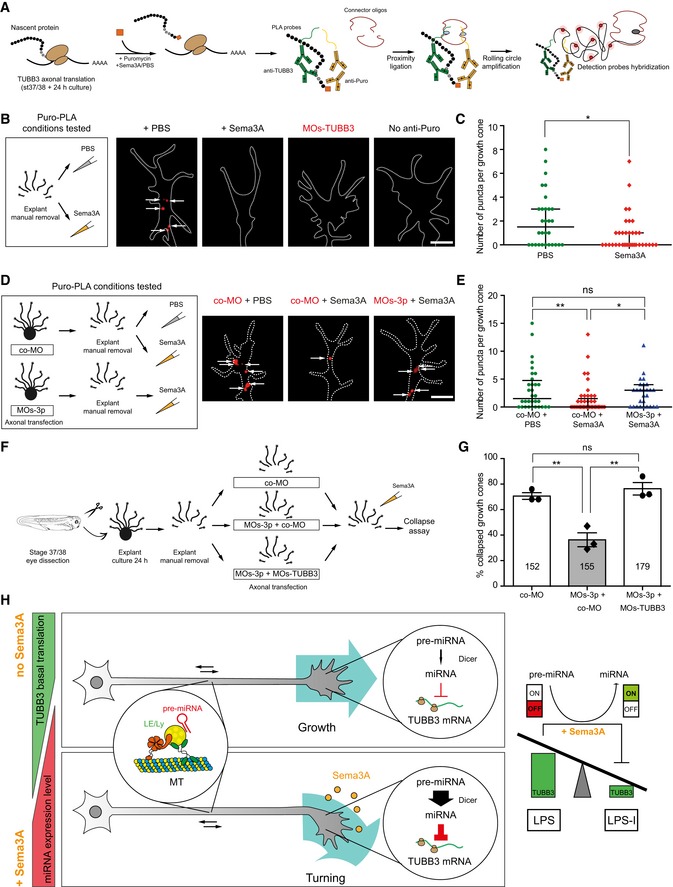
Schematic representation of puromycin‐proximity ligation assay. Concentration used is as follows: 2 ng/μl (puromycin). TUBB3, tubulin beta 3 class III; PLA probes, proximity ligation assay probes.
Schematic representation of the experimental paradigm. Representative images of local translation events of TUBB3 in the growth cone. Dashed white line delineates the growth cone. Each white arrow points to a puro‐PLA puncta. TUBB3, tubulin beta 3 class III; Puro, puromycin. Scale bars: 5 μm.
Quantification of number of puncta per growth cone. Each data point corresponds to one growth cone. Total number of growth cones analyzed is as follows: 30 (PBS) and 36 (Sema3A). n = 2 independent experiments. Values are median with interquartile range.
Schematic representation of the experimental paradigm. Concentrations used are as follows: 2 μM co‐MO; 2 μM MOs‐3p; 200 ng/ml Sema3A. Representative images of local translation events of TUBB3 in the growth cone of transfected axons. Dashed white line delineates the growth cone. White arrows represent number of puro‐PLA puncta per growth cone. co‐MO, control morpholino. Scale bars: 5 μm.
Quantification of number of puncta per growth cone. Each data point corresponds to one growth cone. Total number of growth cones analyzed is as follows: 32 (co‐MO + PBS), 45 (co‐MO + Sema3A), 27 (MOs‐3p + Sema3A). n = 2 independent experiments. Values are median with interquartile range. co‐MO, control morpholino; ns, not significant.
Schematic representation of the experimental paradigm. Concentrations used are as follows: 4 μM co‐MO; 2 μM MOs‐3p + 2 μM co‐MO; 2 μM MOs‐3p + 2 μM MOs‐TUBB3; 200 ng/ml Sema3A. co‐MO, control morpholino; TUBB3, tubulin beta 3 class III.
Percentage of collapsed growth cones in axons transfected with co‐MO, MOs‐3p + co‐MO, and MOs‐3p + MOs‐TUBB3. Each data point corresponds to one independent experiment. Total number of growth cones counted is as follows: 152 (co‐MO), 155 (MOs‐3p + co‐MO), 179 (MOs‐3p + MOs‐TUBB3). n = 3 independent experiments. Values are mean ± SEM. ns, not significant; co‐MO, control morpholino; TUBB3, tubulin beta 3 class III.
Working model: Pre‐miR‐181a‐1 is transported along RGC axons tethered to CD63‐positive late endosomes/lysosomes. Under non‐stimulated conditions, TUBB3 undergoes basal translation in the axonal compartment. Upon Sema3A exposure, pre‐miR‐181a‐1 is locally processed and the expression level of the concomitant newly generated miRNAs increases locally within the growth cone. miR‐181a‐5p, the predominant mature miRNA generated from pre‐miR‐181a‐1, targets TUBB3, thereby silencing protein synthesis through LPS inhibition (LPS‐I). ns, not significant; LE/Ly, late endosomes/lysosomes; LPS, local protein synthesis; LPS‐I, LPS inhibition; TUBB3, tubulin beta 3 class III.
< 0.01. Data were not normally distributed (Shapiro–Wilk test) (C, E). Two‐tailed Mann–Whitney test (C). Kruskal–Wallis test followed by Dunn's multiple comparison
test (E). Data were normally distributed (Shapiro–Wilk test). One‐way ANOVA followed by Tukey's multiple comparison
test (G).

