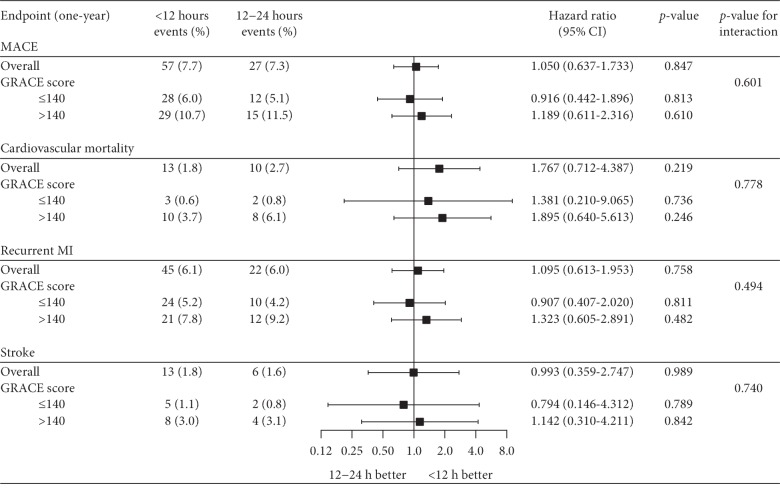
Figure 1.
Forest plot of one-year endpoints in the overall matched population and after stratification by GRACE score. MACE represents a composite of cardiovascular mortality, recurrent MI, and stroke. For each one-year clinical endpoint, event rates are presented for the <12 h and 12–24 h groups along with the hazard ratio and p-value from the corresponding Cox proportional hazards model. For the GRACE score subgroup analysis, the p-value for interaction is presented. CI = confidence interval; GRACE = Global Registry of Acute Coronary Events; MACE = major adverse cardiovascular events; MI = myocardial infarction.

