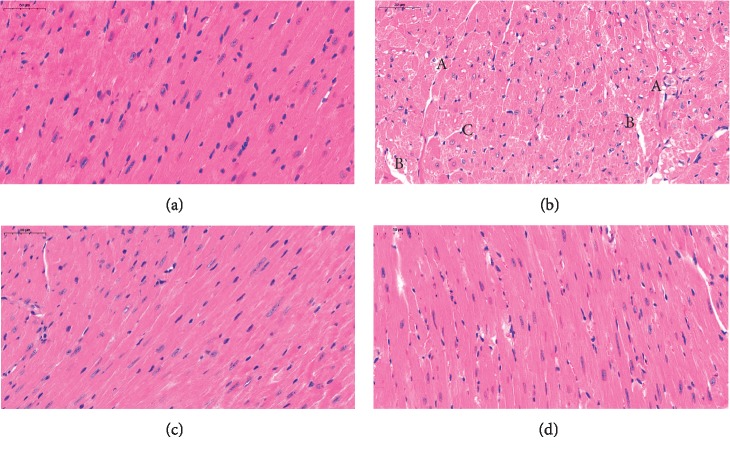
Figure 3.
(a) Control group, (b) OTA group (5 mg/kg body weight), (c) ASX group (100 mg/kg body weight), and (d) ASX+OTA group (100 mg/kg body weight + 5 mg/kg body weight). Photographed heart tissue pathology slides (40x magnification). Mean ± SE of 3 mice per group. (a) indicates cell necrosis+vacuolar degeneration, (b) indicates fragmentation and lysis of myocardial fibers, and (c) indicates cytoplasmic vacuolar degeneration.

