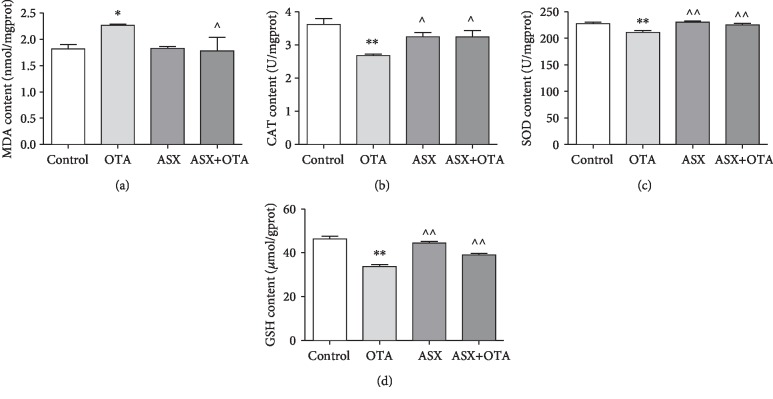
Figure 6.
Oxidative and antioxidant parameters of tissues from each group of mice were measured. (a), (b), (c), and (d) represent changes in MDA, CAT, SOD, and GSH, respectively. ∗Significantly different from control (P < 0.05). ∗∗Significantly different from control (P < 0.01). ^^Significantly different from the OTA group (P < 0.01). ^Significantly different from the OTA group (P < 0.05).

