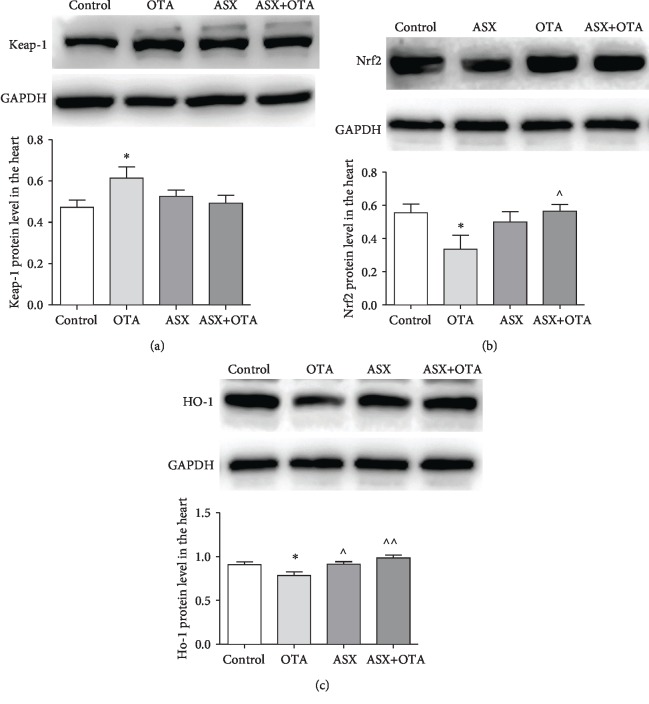
Figure 7.
(a), (b), and (c) indicate Keap-1, Nrf2, and HO-1, respectively. Mean ± SD of 3 mice per group. ∗Significantly different from control (P < 0.05). ∗∗Significantly different from control (P < 0.01). ^^Significantly different from the OTA group (P < 0.01). ^Significantly different from the OTA group (P < 0.05).

