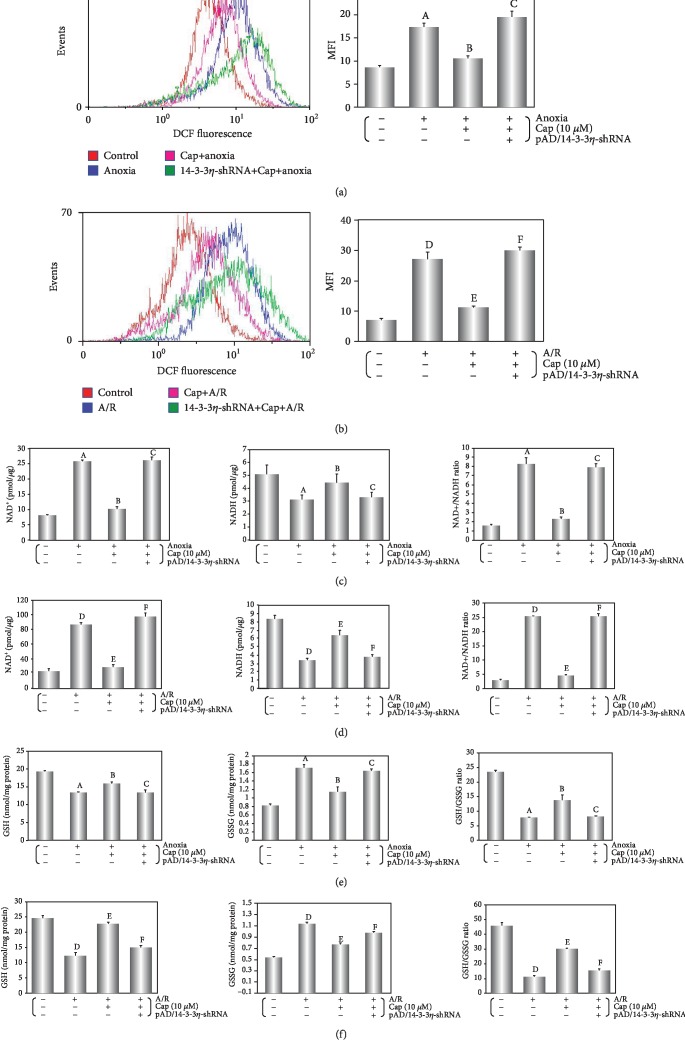
Figure 3.
Cap reduces ROS generation by maintaining the redox balance following anoxia or A/R injury. (a, b) Fluorescent probe DCFH-DA indicating ROS level was detected by flow cytometry and column chart of average fluorescence intensity values during A/R exposure. (c, d) Mitochondrial NAD levels in cardiomyocytes after different treatments. Left: histogram of mitochondrial NAD+ levels; middle: histogram of mitochondrial NADH levels; right: histogram of mitochondrial NAD+/NADH ratio. (e, f) Intracellular glutathione levels of cardiomyocyte after different treatments. Left: histogram of intracellular GSH levels; middle: histogram of intracellular GSSG levels; right: histogram of intracellular GSH/GSSG ratio. Data are presented as mean ± SEM (n = 6). A: P < 0.01 vs. control group (anoxia); B: P < 0.01 vs. anoxia group; C: P < 0.01 vs. Cap+anoxia group; D: P < 0.01 vs. control group (A/R); E: P < 0.01 vs. A/R group; F: P < 0.01 vs. Cap+A/R group.

