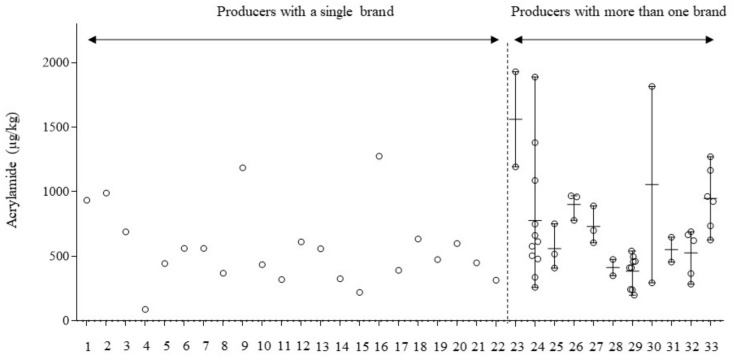
Figure 2.
Acrylamide content in potato crisp samples from the Spanish market, grouped according to their producers (n = 33). Among them: producers with a single brand (n=22) and producers with more than one brand (n=11). Circles represent individual values; horizontal lines represent mean values and vertical lines represent the range for each producer.

