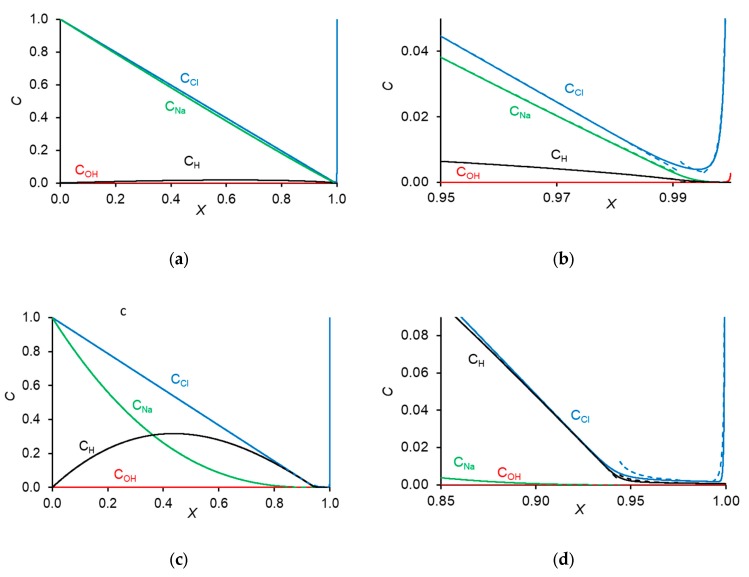
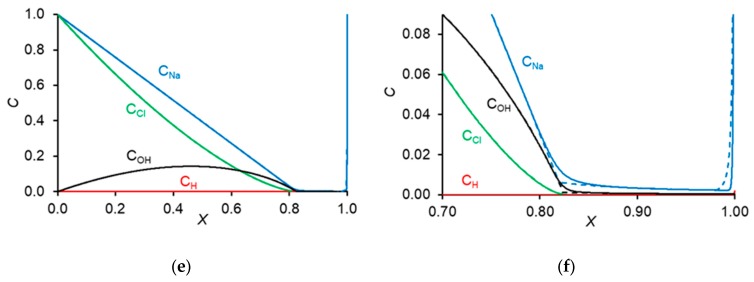
Figure 3.
Concentration profiles of Na+, Cl−, H+, and OH− ions in the depleted DBL near the AEM (a–d) and CEM (e,f) shown at different scales, at current densities I = 1.8 mA cm−2 (a,b) and I = 9.5 mA cm−2 (c–f). Solid and dashed lines were calculated numerically and analytically, respectively. X = 0 relates to the bulk solution, x = 1, to the membrane surface.


