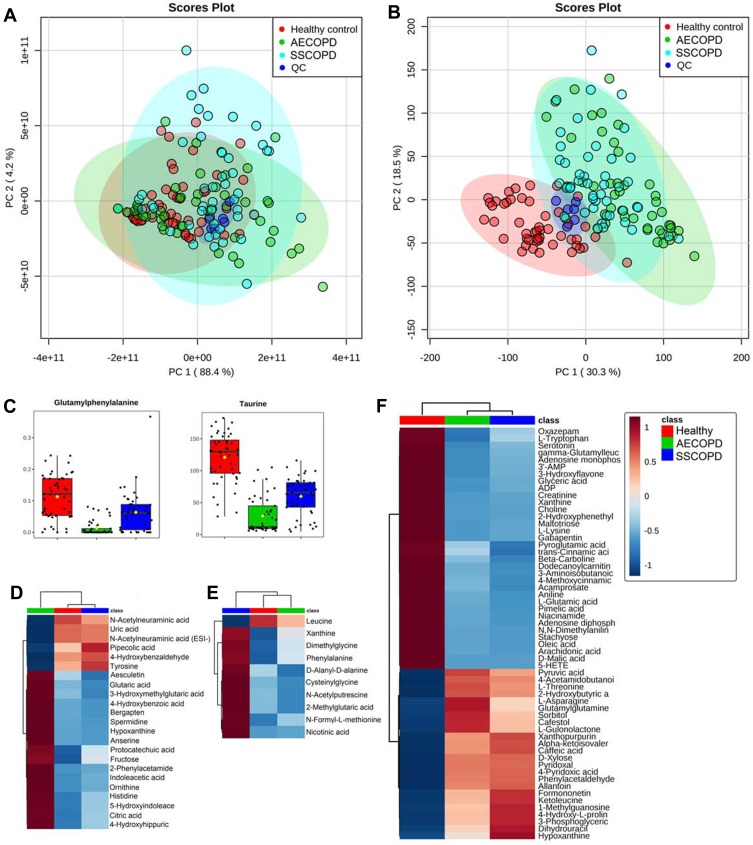
Figure 1.
Dysregulated metabolites revealed by metabolomics. (A and B) Principle component analysis score plots of all sample groups in positive (A) and negative ion mode (B). Groups are presented in different colors (AECOPD, green; SSCOPD (Stable COPD), blue; healthy control, red; QC, dark blue). (C) Grouped scatter plots presenting levels of glutamylphenylalanine and taurine. (D) Heat map presenting metabolites that are only dysregulated in AECOPD. (E) Heat map presenting metabolites that are only dysregulated in SSCOPD (Stable COPD). (F) Heat map presenting metabolites that are only dysregulated in the Healthy control.

