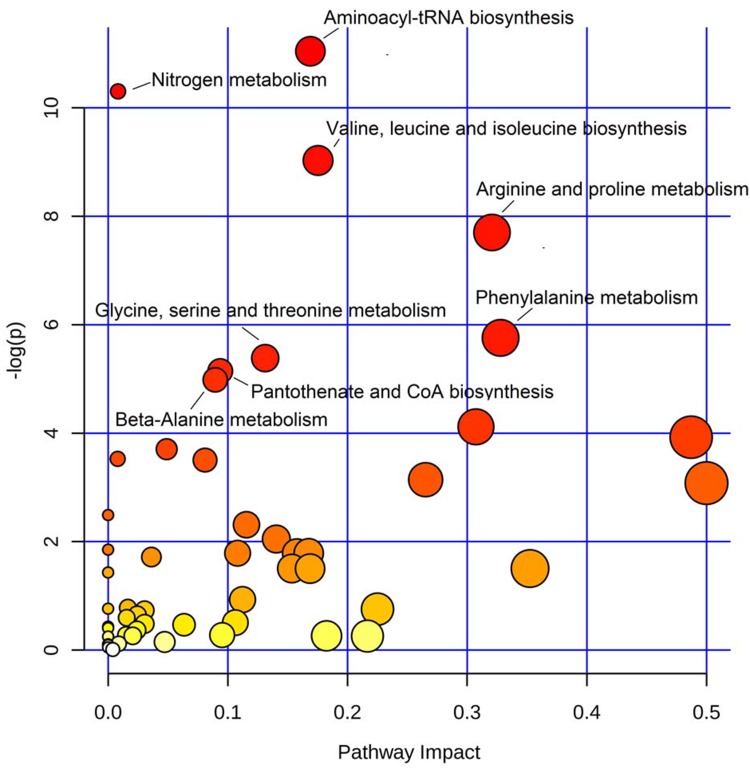
Figure 3.
Metabolic pathways involved in COPD disease onset and progression. Scatter plot presenting enriched metabolic pathways. The color gradient indicates the significance of the pathway ranked by p-value (y-axis; yellow: higher p-values and red: lower p-values), and circle size indicates the pathway impact score (x-axis; the larger circle the higher impact score). Significantly affected pathways with p-value less than 0.01 were marked by names.

