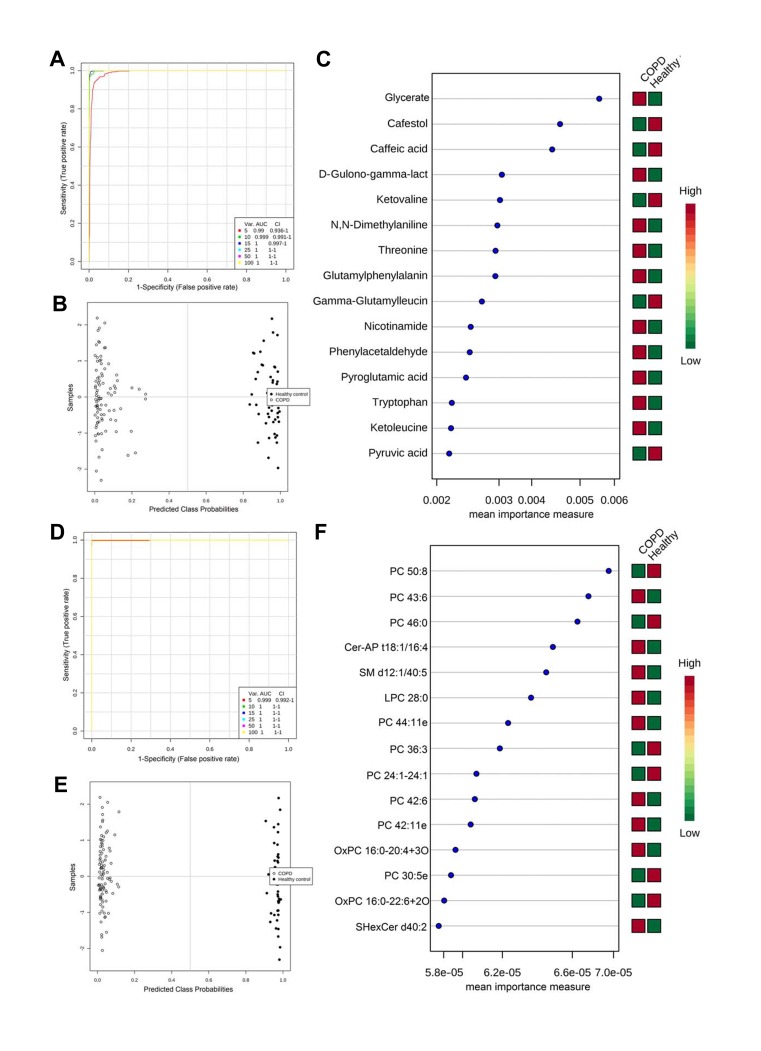
Figure 4.
ROC analysis revealed candidate biomarkers for COPD diagnosis. (A and D) Multivariate ROC curve constructed with 5–100 metabolites (A) or lipids (D) based on the cross-validation (CV) performance. (B and E) The predicted class probabilities (average of the cross-validation) for each sample using the 15 feature model of metabolites (B) or lipids (E). The top 15 metabolites (C) or lipids (F) contributed to the prediction model ranked by mean importance measure and the expressive levels are presented aside by color (red, high; green, low).

