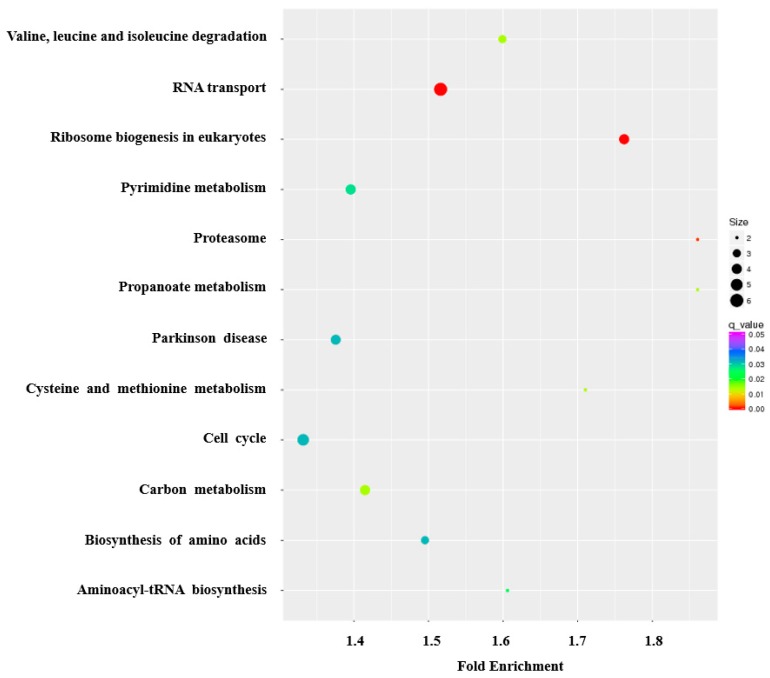
Figure 5.
The KEGG pathway analysis of the differentially expressed genes, shown in bubble chart format. The Y-axis label represents significant pathways, and the X-axis label represents fold enrichment. The size of the bubbles represents the levels of differentially expressed genes enriched in the pathway. The color of the bubbles represents significance.

