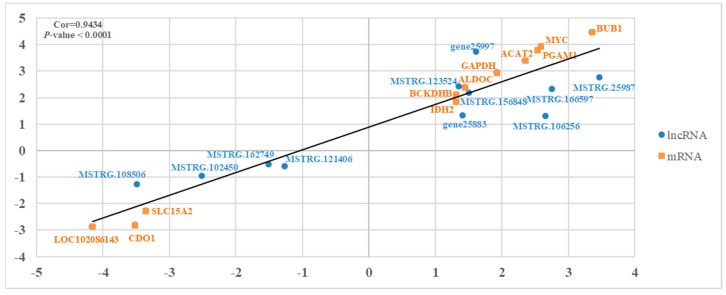
Figure 6.
An illustration of the qPCR confirmation for the RNA-seq. The correlations of the gene expression level of the 11 differentially expressed genes and the 11 lncRNAs between lactating and non-‘lactating’ crops using RNA-Seq and a qRT-PCR. The X-axis and Y-axis show the log2Foldchange (T/C) measured by the RNA-seq and qRT-PCR, respectively. T represents ‘lactating’ pigeons and C represents non-‘lactating’ pigeons. The β-actin gene was used as a housekeeping internal control.

