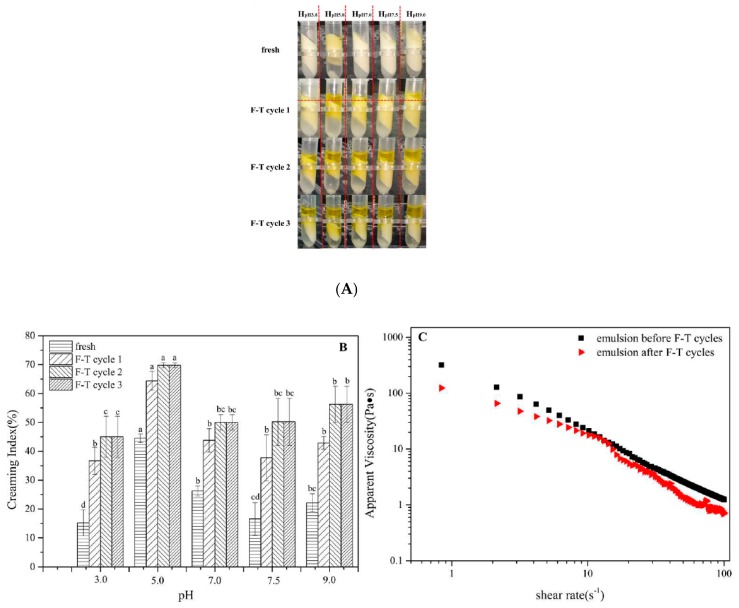
Figure 6.
Olive oil-SPI/pectin Pickering emulsion treated with three freeze-thaw (F-T) cycles (A) apparent appearance; (B) creaming index of emulsions at pH series before and after freeze-thaw cycles. Data represent the mean ± one standard deviation (n = 3). Different lower-case letters represent a significant difference among pHs and freeze-thaw cycles; and (C) apparent viscosity of emulsion at pH3.0 before and after freeze-thaw cycles at 25 °C.

