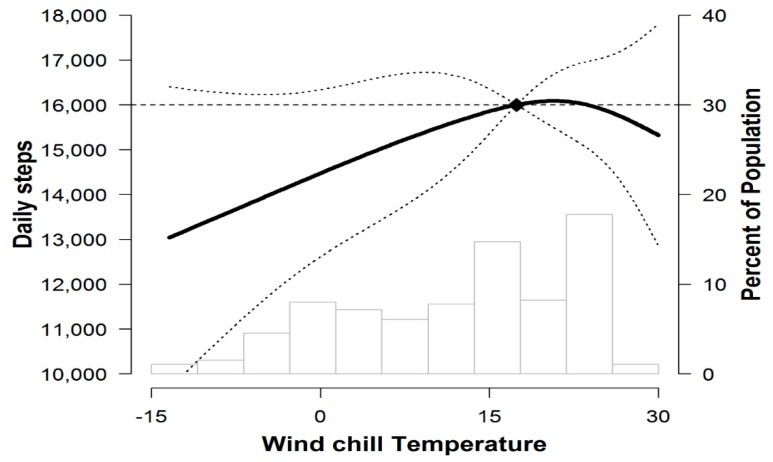
Figure 2.
Mean daily steps (95% CI) by wind chill temperature. The curves represent daily step (solid line) and their 95% confidence intervals (dashed lines) based on restricted cubic splines for wind chill temperature with knots at the 5th, 35th, 65th, and 95th percentiles of their sample distributions. The reference value (diamond dot) was set at the 90th percentile.

