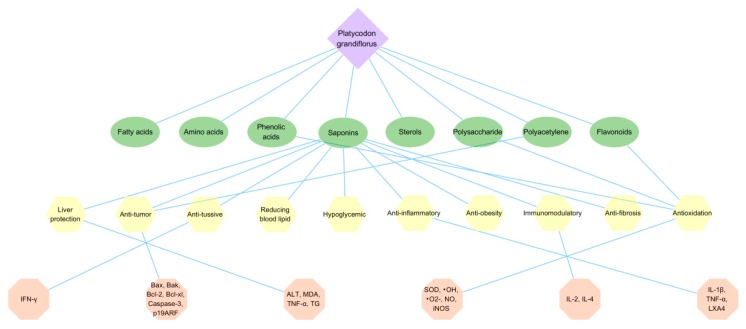
Figure 5.
The pharmacological activity mechanism of P. grandiflorus. The green ovals represent some activity constituents, yellow polygons represent the common pharmacological activities of P. grandiflorus, while represented enzymes and signaling pathways are illustrated by pink polygons. Abbreviations here represent the same meaning as in the body text.

